Downtown Dubai Luxury Real Estate Investment Guide 2026: Prices, ROI, Best Towers

- Downtown Dubai is the most iconic freehold community in the UAE — anchored by Burj Khalifa, Dubai Mall, and the Dubai Fountain — commanding some of the highest price-per-sqft figures in the city.
- Average prices in 2026: studios from AED 800K, 1-beds from AED 1.2M, 2-beds from AED 2M, 3-beds from AED 3.5M, and penthouses from AED 10M+.
- Gross rental yields range from 4–6% — lower than JVC or Dubai South, but backed by the strongest tenant demand and lowest vacancy rates in the city.
- Capital appreciation has averaged 8–12% annually since 2020, with Fountain-view and Burj-view units appreciating faster than internal-view stock.
- Short-term rental (Airbnb) yields can reach 8–10% gross for well-located 1-bed and studio units with DTCM permits — significantly above long-term rental returns.
- Service charges are AED 20–35 per sqft, the highest in Dubai — factor this into any net yield calculation before committing.
- Top investment towers: The Address Downtown, Burj Vista, Boulevard Point, 8 Boulevard Walk, Opera Grand, Forte, Act One Act Two.
Why Downtown Dubai Matters
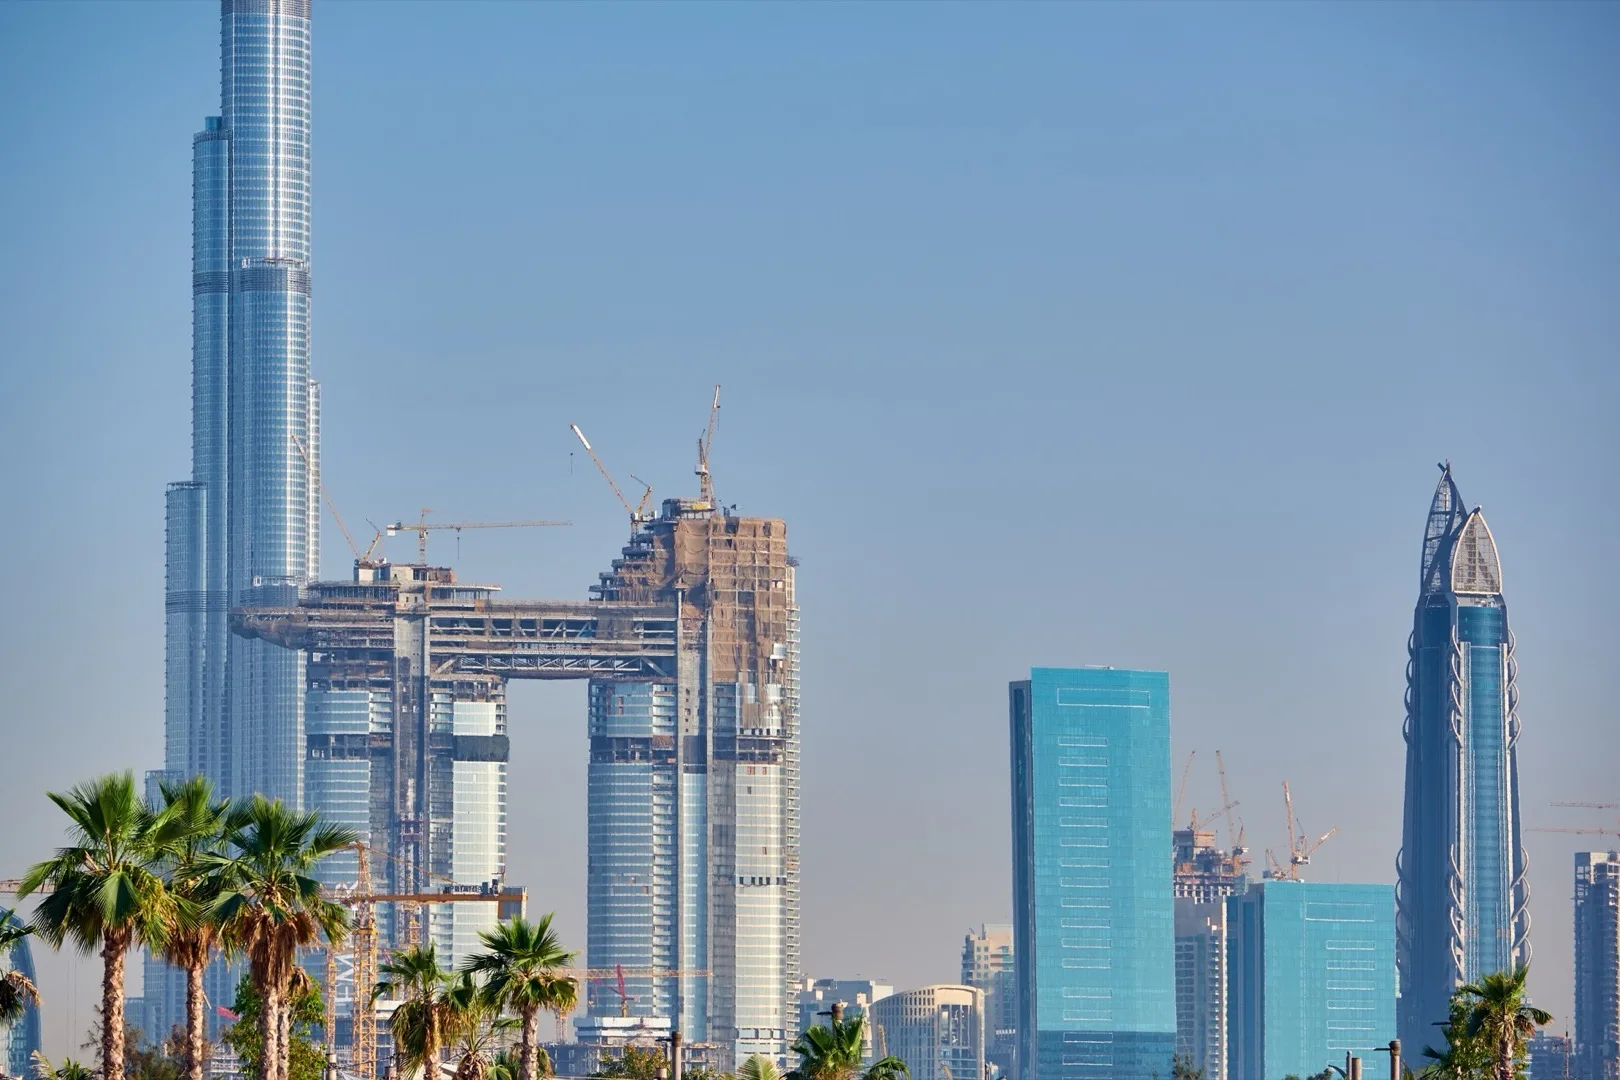
Downtown Dubai is not just a neighbourhood — it is a global landmark. Home to the Burj Khalifa (the world's tallest building at 828 metres), The Dubai Mall (the largest shopping centre on earth by total area), the Dubai Fountain (the world's largest choreographed fountain system), and the Dubai Opera (a 2,000-seat multi-format performing arts venue), this 500-acre master-planned community by Emaar Properties is the single most recognised address in the Middle East.
For investors, what this means is simple: Downtown Dubai enjoys a level of brand recognition and demand insulation that no other community in the UAE can match. It is the first area international buyers search for, the default choice for corporate housing, and the benchmark against which every other Dubai community is measured. When markets correct, Downtown corrects less. When markets recover, Downtown recovers first. This pattern has repeated in every cycle since the area's completion in 2010.
In 2025, Downtown Dubai recorded over 4,800 property transactions worth approximately AED 19.5 billion, according to the Dubai Land Department (DLD). The area maintains a residential occupancy rate above 92%, one of the highest in the city. These are not speculative numbers — they reflect genuine end-user demand from professionals, families, and corporate tenants who want to live at the centre of Dubai's most prestigious district.
This guide provides a comprehensive, data-driven analysis of investing in Downtown Dubai in 2026 — covering prices, yields, towers, service charges, appreciation trends, and whether the premium is justified by the returns.
Sub-Areas Within Downtown Dubai
Downtown Dubai is not a monolithic community. It contains distinct micro-districts, each with different pricing dynamics, tenant profiles, and investment characteristics. Understanding these sub-areas is essential for making informed purchase decisions.
Burj Khalifa District: The core of Downtown, immediately surrounding the Burj Khalifa and Dubai Fountain. Properties here command the highest prices per square foot — AED 2,500–4,500/sqft depending on view and floor level. Fountain-view units carry a 15–25% premium over internal-view units in the same building. The Address Downtown, The Address Boulevard, and Armani Residences sit within this zone. Tenant demand is overwhelmingly corporate and short-term rental oriented.
Old Town: A low-rise, Arabian-style residential cluster featuring traditional architecture with courtyards and walkways. Old Town units (apartments, duplexes, and townhouses) trade at AED 1,800–2,800/sqft — lower than the high-rise towers but offering a unique lifestyle proposition. These units appeal to long-term residents and families who prefer a quieter setting within Downtown. Rental yields here tend to be slightly lower (3.5–4.5%) but occupancy is exceptionally stable.
Opera District: The southern section of Downtown, centred around the Dubai Opera and anchored by Emaar's Opera Grand and Act One Act Two towers. This sub-area has emerged as the cultural heart of Downtown, attracting tenants who value walkability to entertainment and dining. Prices range from AED 2,200–3,200/sqft with yields matching or slightly exceeding the Burj Khalifa District due to newer building stock and more efficient layouts.
Boulevard (Sheikh Mohammed bin Rashid Boulevard): The 3.5-kilometre loop road that defines Downtown's perimeter, lined with retail, dining, and residential towers. Boulevard Point, 8 Boulevard Walk, and Boulevard Crescent sit along this stretch. Units here offer a balance of accessibility and lifestyle, with prices at AED 2,000–3,000/sqft and strong walk-in tenant demand.
Burj Vista Area: Located on the western edge of Downtown, the twin Burj Vista towers offer direct Burj Khalifa views at slightly more accessible price points (AED 1,800–2,600/sqft). This sub-area is popular with mid-budget investors seeking the Downtown address without paying full Fountain-view premiums.
DIFC-Adjacent Towers: Several Downtown towers sit within walking distance of the Dubai International Financial Centre, making them popular with finance professionals. Forte and Index Tower benefit from this proximity, with corporate tenancies driving above-average occupancy rates.
Property Types and 2026 Price Ranges
Downtown Dubai's residential stock is predominantly apartments — ranging from compact studios to ultra-luxury penthouses. Here is the current pricing landscape based on Q1 2026 transaction data from the DLD and major brokerages.
| Property Type | Size Range (sqft) | Price Range (AED) | Avg Price/sqft (AED) | Typical Annual Rent (AED) |
|---|---|---|---|---|
| Studio | 350–550 | 800K – 1.2M | 2,000–2,400 | 55K – 75K |
| 1-Bedroom | 650–950 | 1.2M – 2.2M | 1,800–2,600 | 80K – 130K |
| 2-Bedroom | 1,100–1,600 | 2M – 4M | 1,800–2,800 | 130K – 200K |
| 3-Bedroom | 1,800–2,800 | 3.5M – 7M | 1,900–2,800 | 200K – 350K |
| Penthouse | 3,500–10,000+ | 10M – 50M+ | 2,800–5,000+ | 500K – 1.5M+ |
A critical nuance: view premiums in Downtown are more pronounced than in any other Dubai community. A 1-bedroom apartment in The Address Downtown with a full Fountain view can trade at AED 2.2M, while the identical layout facing the parking structure might sell for AED 1.4M. Always verify the view orientation before comparing prices.
Top Towers for Investment
Not all Downtown towers are equal from an investment perspective. The following towers have consistently delivered the best combination of rental yield, occupancy, capital appreciation, and liquidity. This analysis is based on 2024–2025 transaction data and rental market performance.
| Tower | Completion | Avg Price/sqft (AED) | Gross Yield | Service Charge (AED/sqft) | Key Advantage |
|---|---|---|---|---|---|
| The Address Downtown | 2008 | 2,800–3,500 | 4.5–5.5% | 28–32 | Hotel-managed, Fountain view, highest STR demand |
| Burj Vista | 2018 | 1,900–2,500 | 5.0–6.0% | 20–24 | Direct Burj view, lower entry, strong yield |
| Boulevard Point | 2018 | 2,000–2,600 | 5.0–5.8% | 22–26 | Boulevard frontage, retail below, high walkability |
| 8 Boulevard Walk | 2012 | 1,800–2,300 | 5.2–6.0% | 20–24 | Lowest entry price, efficient layouts, strong yield |
| Opera Grand | 2020 | 2,400–3,000 | 4.8–5.5% | 24–28 | Newest stock, Opera District lifestyle, premium finishes |
| Forte | 2014 | 2,200–2,800 | 4.5–5.2% | 24–28 | DIFC proximity, corporate tenant base, low vacancy |
| Act One Act Two | 2020 | 2,300–2,900 | 4.8–5.6% | 24–28 | Opera views, modern design, strong appreciation |
Investment takeaway: For pure yield-focused investors, Burj Vista and 8 Boulevard Walk offer the best returns due to lower entry prices and efficient layouts. For capital appreciation and prestige, The Address Downtown and Opera Grand lead the field. For balanced performance, Boulevard Point and Act One Act Two strike the ideal middle ground.
Rental Yields Analysis
Downtown Dubai's gross rental yields of 4–6% are frequently criticised for being below Dubai's city-wide average of 6–8%. This criticism misses critical context. Let's examine why.
Vacancy rates: Downtown maintains a residential vacancy rate of approximately 5–8%, compared to 12–18% in areas like JVC, Dubai South, or International City. When you adjust for vacancy, Downtown's effective yield gap narrows significantly. A 5.5% gross yield with 95% occupancy produces AED 52,250 per AED 1M invested — while an 8% gross yield in JVC with 82% occupancy produces AED 65,600. The gap is AED 13,350, not the AED 25,000 that headline yields suggest.
Tenant quality: Downtown tenants skew toward professionals, corporate relocations, and high-net-worth individuals. These tenants pay on time, maintain properties, and renew leases — reducing turnover costs (typically 4–8% of annual rent per changeover) and maintenance expenditure.
Rent growth: Downtown rents have grown 6–9% annually since 2022, outpacing most other areas on an absolute-value basis. A 7% increase on AED 120,000 rent adds AED 8,400, while a 7% increase on AED 55,000 in JVC adds AED 3,850. Absolute rent growth favours premium locations.
For investors focused on total return (yield + appreciation), Downtown consistently outperforms higher-yield areas. Over a 5-year hold from 2020 to 2025, a typical Downtown 1-bedroom generated approximately 75–90% total return (rent + appreciation), compared to 60–75% for equivalent JVC properties. The premium location earned its premium price.
Capital Appreciation: 2020–2026 Price Trends
Downtown Dubai's capital appreciation story over the past six years has been one of resilience and recovery followed by sustained growth.
2020 (COVID trough): Average prices hit cycle lows at approximately AED 1,400–1,600/sqft. Distressed sellers and uncertainty created a buyer's market that, in hindsight, represented the best entry point of the decade.
2021–2022 (Recovery): Prices rebounded 15–25% as international buyers returned post-COVID, driven by Dubai's early reopening, Golden Visa expansion, and the Expo 2020 effect. Average prices reached AED 1,800–2,100/sqft.
2023–2024 (Acceleration): Strong immigration, record transaction volumes, and limited new supply within Downtown pushed prices to AED 2,200–2,600/sqft. Fountain-view premium units broke AED 3,500/sqft for the first time since 2014.
2025–2026 (Stabilisation at new highs): Average prices have settled at AED 2,200–2,800/sqft, with ultra-premium units exceeding AED 4,000/sqft. Year-over-year growth has moderated to 5–8% as the market absorbs new pricing levels. Downtown is now trading at or above its 2014 peak on a per-sqft basis — but with significantly stronger rental fundamentals underpinning valuations.
The compounded capital appreciation from 2020 to 2026 is approximately 55–75% depending on the specific tower and unit type. Investors who entered during 2020–2021 have seen exceptional returns. For 2026 entrants, the question is whether further upside exists — and the answer lies in supply constraints. Downtown has virtually no undeveloped land remaining, limiting future competition and supporting long-term price floors.
Short-Term Rental Potential
Downtown Dubai is one of the most lucrative short-term rental markets in the UAE, thanks to its proximity to the world's most-visited tourist attractions. For investors considering the Airbnb strategy in Dubai, Downtown is a top-tier location.
DTCM permit requirement: All short-term rentals in Dubai require a Department of Tourism and Commerce Marketing (DTCM) holiday home permit. The process involves registering with an approved holiday home operator or obtaining a self-operator licence. Annual costs run AED 3,000–8,000 depending on the arrangement. Operating without a permit risks fines of AED 50,000+.
Achievable nightly rates: Studios command AED 350–600/night, 1-bedrooms AED 500–1,000/night, and 2-bedrooms AED 800–1,800/night. Fountain-view units command 40–60% premiums over non-view units. Peak season (October–March) rates can be 30–50% higher than summer rates.
Occupancy: Well-managed Downtown Airbnb units achieve 75–85% annual occupancy. The year-round tourist flow to Burj Khalifa and Dubai Mall provides a baseline demand floor that most other areas lack.
Net yields: After deducting management fees (15–20%), DTCM licence, cleaning, utilities, furniture depreciation, and service charges, net short-term rental yields in Downtown range from 6–8% for standard units and 8–10% for premium Fountain-view studios and 1-bedrooms. This represents a 2–4% yield uplift over long-term rentals, but comes with higher management complexity and regulatory compliance requirements.
Use our ROI Calculator to model specific short-term rental scenarios for Downtown units.
Free Weekly Insights
Get Dubai Market Updates in Your Inbox
Expert analysis, market data, and practical tips — trusted by Dubai professionals.
✓ You're in! Check your inbox.
Downtown Dubai vs Business Bay vs DIFC
Investors frequently compare Downtown with its two immediate neighbours: Business Bay and DIFC. The three areas share geographic proximity but differ significantly in pricing, yields, and tenant demographics. For a deeper dive into this comparison, see our Business Bay vs Downtown vs DIFC guide.
| Factor | Downtown Dubai | Business Bay | DIFC |
|---|---|---|---|
| Avg Price/sqft (AED) | 2,200–2,800 | 1,400–2,000 | 2,500–3,500 |
| Gross Yield | 4.5–6.0% | 5.5–7.5% | 3.8–5.0% |
| Service Charge (AED/sqft) | 20–35 | 14–22 | 25–40 |
| Vacancy Rate | 5–8% | 10–15% | 8–12% |
| Tenant Profile | Premium professionals, tourists, corporates | Young professionals, mid-level corporates | Finance executives, legal professionals |
| STR Potential | Excellent (Burj Khalifa draw) | Good (Canal views) | Limited (business district) |
| New Supply Risk | Very low (land exhausted) | High (30,000+ units pipeline) | Low (limited residential plots) |
| Capital Appreciation (5Y) | 55–75% | 45–65% | 40–55% |
Verdict: Business Bay offers better entry-level yields and lower capital outlay — ideal for yield-focused investors comfortable with higher supply risk. DIFC commands the highest per-sqft prices but with the lowest yields, catering to a niche ultra-premium market. Downtown Dubai occupies the sweet spot: premium-but-not-extreme pricing, strong yields for the tier, and the best capital appreciation track record, supported by near-zero new supply risk. For a broader location comparison, also see our Downtown vs Dubai Creek Harbour analysis.
Buyer Profiles: Who Invests in Downtown Dubai?
Downtown attracts three distinct buyer profiles, each with different objectives and strategies:
End-users (35–40% of transactions): High-income professionals and families who want to live in Dubai's most prestigious community. These buyers prioritise lifestyle, school proximity, and walkability over yield calculations. They typically purchase 2–3 bedroom units in premium towers and hold long-term. End-user demand provides a stable price floor during market corrections.
Long-term investors (40–45% of transactions): Domestic and international investors seeking a combination of rental income and capital appreciation. These buyers favour 1-bedroom and studio units for optimal yield efficiency. Many target the Golden Visa threshold (AED 2M minimum property value), making Downtown's pricing a natural fit. Corporate housing demand — multinationals leasing units for relocating executives — provides an additional demand layer unique to Downtown.
Short-term rental operators (15–20% of transactions): Investors specifically targeting Airbnb and holiday home income. These buyers focus on Fountain-view studios and 1-bedrooms in hotel-serviced towers like The Address Downtown. The strategy requires active management but delivers the highest gross yields in the area. This segment has grown significantly since 2023 as DTCM has streamlined the permitting process.
Service Charges: The Hidden Cost
Downtown Dubai's service charges are among the highest in the city, and they deserve serious attention in any investment calculation. Ignoring service charges is the single most common mistake investors make when evaluating Downtown properties.
| Tower | Service Charge (AED/sqft) | Annual Cost (1-Bed, 800 sqft) | % of Annual Rent |
|---|---|---|---|
| The Address Downtown | 28–32 | AED 22,400–25,600 | 20–25% |
| Burj Vista | 20–24 | AED 16,000–19,200 | 16–19% |
| 8 Boulevard Walk | 20–24 | AED 16,000–19,200 | 15–18% |
| Opera Grand | 24–28 | AED 19,200–22,400 | 18–22% |
| Dubai Average (mid-range) | 12–18 | AED 9,600–14,400 | 12–16% |
Downtown service charges are AED 20–35/sqft versus a city average of AED 12–18/sqft. This means a 1-bedroom unit incurs AED 16,000–28,000 annually in service charges alone — eating 15–25% of gross rental income. Hotel-managed towers like The Address are at the top of this range due to shared hotel amenities, concierge services, and premium common area maintenance.
When calculating net yield, always deduct service charges, RERA fees (AED 210), DLD tenancy registration (AED 220), and any management fees. A 5.5% gross yield can drop to 3.5–4% net after these deductions. This is still competitive for a Tier-1 global city location, but investors who only look at gross yields will be disappointed by actual cash flow.
Connectivity and Infrastructure
Downtown Dubai's connectivity is a significant component of its investment thesis. The area is among the best-connected communities in the UAE.
Metro: Burj Khalifa/Dubai Mall Metro Station (Red Line) sits directly beneath the community, providing direct access to Dubai Marina (25 minutes), DIFC (5 minutes), Deira (20 minutes), and Dubai International Airport Terminal 3 (25 minutes). The metro station recorded over 18 million passenger trips in 2025, confirming it as one of the busiest on the network.
Roads: Sheikh Zayed Road (E11) runs along Downtown's western boundary, providing direct highway access to Abu Dhabi (60 minutes), Dubai Marina (15 minutes), and Jebel Ali (25 minutes). Al Khail Road flanks the eastern side, offering an alternative route to Business Bay, Dubai Healthcare City, and southern districts. The Financial Center Road connects Downtown to DIFC in under 3 minutes by car.
Walkability: Downtown is the most walkable community in Dubai. The Boulevard loop, Souk Al Bahar promenade, and Dubai Mall pedestrian bridges create a connected pedestrian network that allows residents to access groceries, dining, entertainment, fitness, and transit without a car. This walkability is a major differentiator for expatriate tenants relocating from walkable European and Asian cities.
Future connectivity: The Dubai Metro Route 2020 extension has improved connectivity to Expo City Dubai and Dubai South. Plans for additional pedestrian and cycling infrastructure along the Dubai Water Canal further enhance Downtown's non-vehicular connectivity to Business Bay and Jumeirah.
Pros and Cons of Investing in Downtown Dubai
Pros:
- Unmatched brand equity: The Burj Khalifa address carries global recognition that no other Dubai community can replicate. This translates to consistent demand from end-users, tenants, and tourists.
- Supply constraint: With virtually no undeveloped land remaining, new supply is limited to rare infill projects. This protects existing unit values from the dilution risk that affects newer communities.
- Diversified demand: Long-term tenants, corporate housing, short-term rentals, and end-users create multiple demand pillars. If one segment weakens, others compensate.
- Liquidity: Downtown is the most liquid residential market in Dubai. Units sell faster and with smaller bid-ask spreads than comparable properties elsewhere.
- Capital preservation: During the 2018–2020 downturn, Downtown prices fell 15–20% while some outer areas fell 30–40%. The floor is higher here.
- STR upside: Fountain-view Airbnb units generate some of the highest per-night rates in the entire city.
Cons:
- High entry price: Minimum investment for a quality unit is AED 800K (studio) to AED 1.2M (1-bed). This is 40–60% more than equivalent units in JVC, Dubai South, or International City.
- Elevated service charges: AED 20–35/sqft significantly reduces net yield compared to newer communities with lower charges.
- Lower gross yields: At 4–6%, Downtown trails yield-leaders like JVC (7–9%), DSO (7–8%), and Dubai South (7–9%). Income-focused investors may find better cash-on-cash returns elsewhere.
- Traffic congestion: Despite excellent metro access, road congestion during peak hours and events (New Year, Eid, major concerts) can be frustrating. Parking is limited and expensive in some towers.
- Ageing stock: Many Downtown towers are 12–18 years old. While Emaar maintains common areas well, individual units may require renovation investment to remain competitive in the rental market.
- Limited upside at current prices: With prices at or above historical peaks, the 20–30% annual appreciation seen in 2021–2023 is unlikely to repeat. Investors should expect moderate 5–8% annual growth rather than boom-era returns.
Market Outlook: What to Expect in 2026–2028
Downtown Dubai's market trajectory for the next two to three years is shaped by three competing forces: constrained supply, macro-economic uncertainty, and evolving demand patterns.
Supply: Fewer than 1,500 new residential units are expected to be delivered within Downtown Dubai between 2026 and 2028. This is negligible relative to the existing stock of approximately 35,000 units. Unlike Business Bay (which has 30,000+ units in its pipeline) or Dubai South (50,000+ units planned), Downtown faces no meaningful supply-side pressure. This is the area's single strongest investment argument.
Demand: Dubai's population continues to grow at 3%+ annually, driven by corporate relocations, Golden Visa holders, and digital nomads. The government's D33 economic agenda targets doubling GDP by 2033, which implies sustained high-end employment growth. Downtown's positioning as the default premium residential address means it will continue to capture the top tier of this demand.
Price trajectory: We project 5–8% annual appreciation for Downtown Dubai over 2026–2028, moderating from the 10–15% growth seen in 2022–2024. This reflects the area reaching price maturity rather than any fundamental weakness. Fountain-view and premium units may outperform this range; internal-view units in older towers may underperform.
Rental trajectory: Rents are expected to grow 4–6% annually, supported by population growth and limited new supply. The shift toward remote and hybrid work is slightly negative for Downtown (some tenants prefer larger suburban units), but this is offset by increased demand for short-term rentals and furnished corporate housing.
Risk factors: A global recession, oil price collapse, or significant geopolitical escalation could slow demand. However, Downtown's diversified buyer base (over 200 nationalities) provides resilience against single-country economic shocks. The most realistic near-term risk is oversupply in adjacent areas (particularly Business Bay) creating indirect pricing pressure through tenant migration.
Frequently Asked Questions
Is Downtown Dubai a good investment in 2026?
Yes, for investors who prioritise capital preservation, stable demand, and total return over maximum yield. Downtown offers 4–6% gross rental yields with 55–75% capital appreciation over the past five years. The near-zero new supply pipeline protects property values from dilution. However, if your primary objective is maximising cash-on-cash yield, areas like JVC or Dubai South offer higher gross returns at lower entry prices. Downtown is best suited for investors with a 5+ year horizon who want premium-grade assets with strong liquidity.
What is the minimum budget to invest in Downtown Dubai?
The realistic minimum for a quality investment unit is approximately AED 800,000 for a well-located studio or AED 1.2 million for a 1-bedroom apartment. These figures include the purchase price only — budget an additional 7–8% for DLD transfer fee (4%), agent commission (2%), and administrative costs (1–2%). For Golden Visa eligibility (AED 2M minimum), you would need a 2-bedroom or a premium 1-bedroom. Mortgage financing is available for UAE residents at up to 80% LTV for properties under AED 5M.
Can I do Airbnb in Downtown Dubai?
Yes, but you need a DTCM holiday home permit. You can either register through an approved holiday home operator (who handles the licence and management for 15–20% of revenue) or obtain a self-operator licence if you plan to manage the property yourself. Fountain-view studios and 1-bedrooms achieve the highest nightly rates (AED 500–1,000/night) and 75–85% annual occupancy. Net yields after all costs typically range from 6–10%, significantly above long-term rental returns. Check your building's specific rules — some towers restrict or prohibit short-term rentals.
Which tower in Downtown Dubai has the best ROI?
For pure rental yield, Burj Vista and 8 Boulevard Walk consistently deliver the highest gross returns (5–6%) thanks to lower price-per-sqft entry points and reasonable service charges. For total return (yield + appreciation), The Address Downtown and Opera Grand have delivered the strongest combined performance, though their higher entry prices and service charges reduce net cash yield. Boulevard Point offers the best balance of yield, appreciation, and liquidity. The "best" tower depends on whether you are optimising for income, growth, or both.
Are Downtown Dubai service charges too high?
Downtown service charges (AED 20–35/sqft) are the highest in Dubai and can consume 15–25% of gross rental income. They are objectively expensive compared to JVC (AED 8–14/sqft) or Dubai Hills (AED 12–18/sqft). However, these charges fund premium amenities — 24/7 concierge, extensive landscaping, pools, gyms, and the maintenance of shared infrastructure around Burj Khalifa and the Boulevard. High service charges also contribute to property value preservation by maintaining building quality. The key is to factor them into your net yield calculation before purchase, not after. A 5.5% gross yield that drops to 3.5% net may still be acceptable for a Tier-1 asset — but only if you expected it.
How does Downtown Dubai compare to Dubai Creek Harbour?
Dubai Creek Harbour is positioned as Emaar's "next Downtown" — a waterfront master community anchored by the upcoming Dubai Creek Tower. Prices there are 30–40% lower than Downtown (AED 1,400–2,000/sqft vs AED 2,200–2,800/sqft), and gross yields are slightly higher at 5.5–7%. However, Creek Harbour is still developing — amenities, retail, and community maturity lag behind Downtown significantly. Downtown offers proven demand, established infrastructure, and near-zero supply risk. Creek Harbour offers growth potential and more space for your budget, but with execution and timeline risk. For investors with a 7–10 year horizon, Creek Harbour could outperform. For 3–5 year holds, Downtown's certainty is hard to beat. See our full Creek Harbour vs Downtown comparison for detailed analysis.
Disclaimer: This article is for informational purposes only and does not constitute financial, legal, or investment advice. Property prices, rental yields, and market conditions are based on publicly available data as of Q1 2026 and are subject to change. Past performance does not guarantee future results. Always conduct independent due diligence and consult with qualified professionals before making any investment decision. Data sources include the Dubai Land Department, RERA, Emaar Properties, and licensed brokerage reports.
Have Questions?
Get personalized advice from our Dubai real estate team.
Thank You!
We'll get back to you within 24 hours.
Real Estate Agencies in Dubai
Explore providers from our business directory
Still have questions?
Ask a follow-up, or get connected with a vetted Dubai professional.
Join our Telegram channel
Handover alerts, new launches & DLD data — first, in real time.