Dubai Real Estate Market Cycles: 20 Years of Data & What History Tells Us About 2027–2028

- Four complete cycles since 2003: boom (2003–2008), crash (2008–2011), recovery-correction (2012–2019), and the current bull run (2020–present).
- Average cycle length: 5–7 years from peak to peak. The current upswing began in late 2020, making 2026 the 6th year — historically the period where caution begins.
- The 2008 crash saw 60% peak-to-trough declines. The 2015–2019 correction was gentler at 25–35%. Each successive downturn has been less severe as the market matures.
- Leading indicators: Transaction volumes peak 6–12 months before prices. Mortgage approval rates, developer launch frequency, and visa issuance data are the most reliable forward signals.
- Is this time different? Structural arguments exist (visa reforms, economic diversification, population growth targets) but so did they in 2007. The prudent approach is to invest selectively, avoid maximum leverage, and build positions that survive a 20–30% correction.
- Bottom line: The market is in a late-cycle phase but not necessarily at a peak. Selective buying in undervalued areas remains rational. Speculative flipping at today's prices carries elevated risk.
Every investor who enters Dubai's property market hears two contradictory narratives. The bulls say Dubai has fundamentally changed — visa reforms, population growth, economic diversification, and regulatory maturity mean the old boom-bust pattern is dead. The bears say cycles are cycles, and no amount of structural reform repeals the laws of supply and demand. Both sides make compelling arguments.
The truth, as usual, lives somewhere in the data. Dubai's real estate market has twenty years of transaction records, price indices, and supply pipeline data — enough to identify patterns, measure cycle durations, and build a framework for understanding where we are today. This article presents that data without the cheerleading or doom-saying that dominates most market commentary.
Whether you are considering buying property in Dubai or evaluating an exit from existing holdings, understanding market cycles is not optional — it is the single most important analytical framework for long-term success.
Cycle 1: The Pre-2008 Boom (2003–2008)
What Happened
Dubai's modern property market effectively began in 2002 when the emirate allowed foreigners to purchase freehold property for the first time. The legislation — Decree No. 7 of 2006 (though freehold sales began informally in 2002–2003) — unlocked a flood of international capital that had been shut out of the Gulf property market.
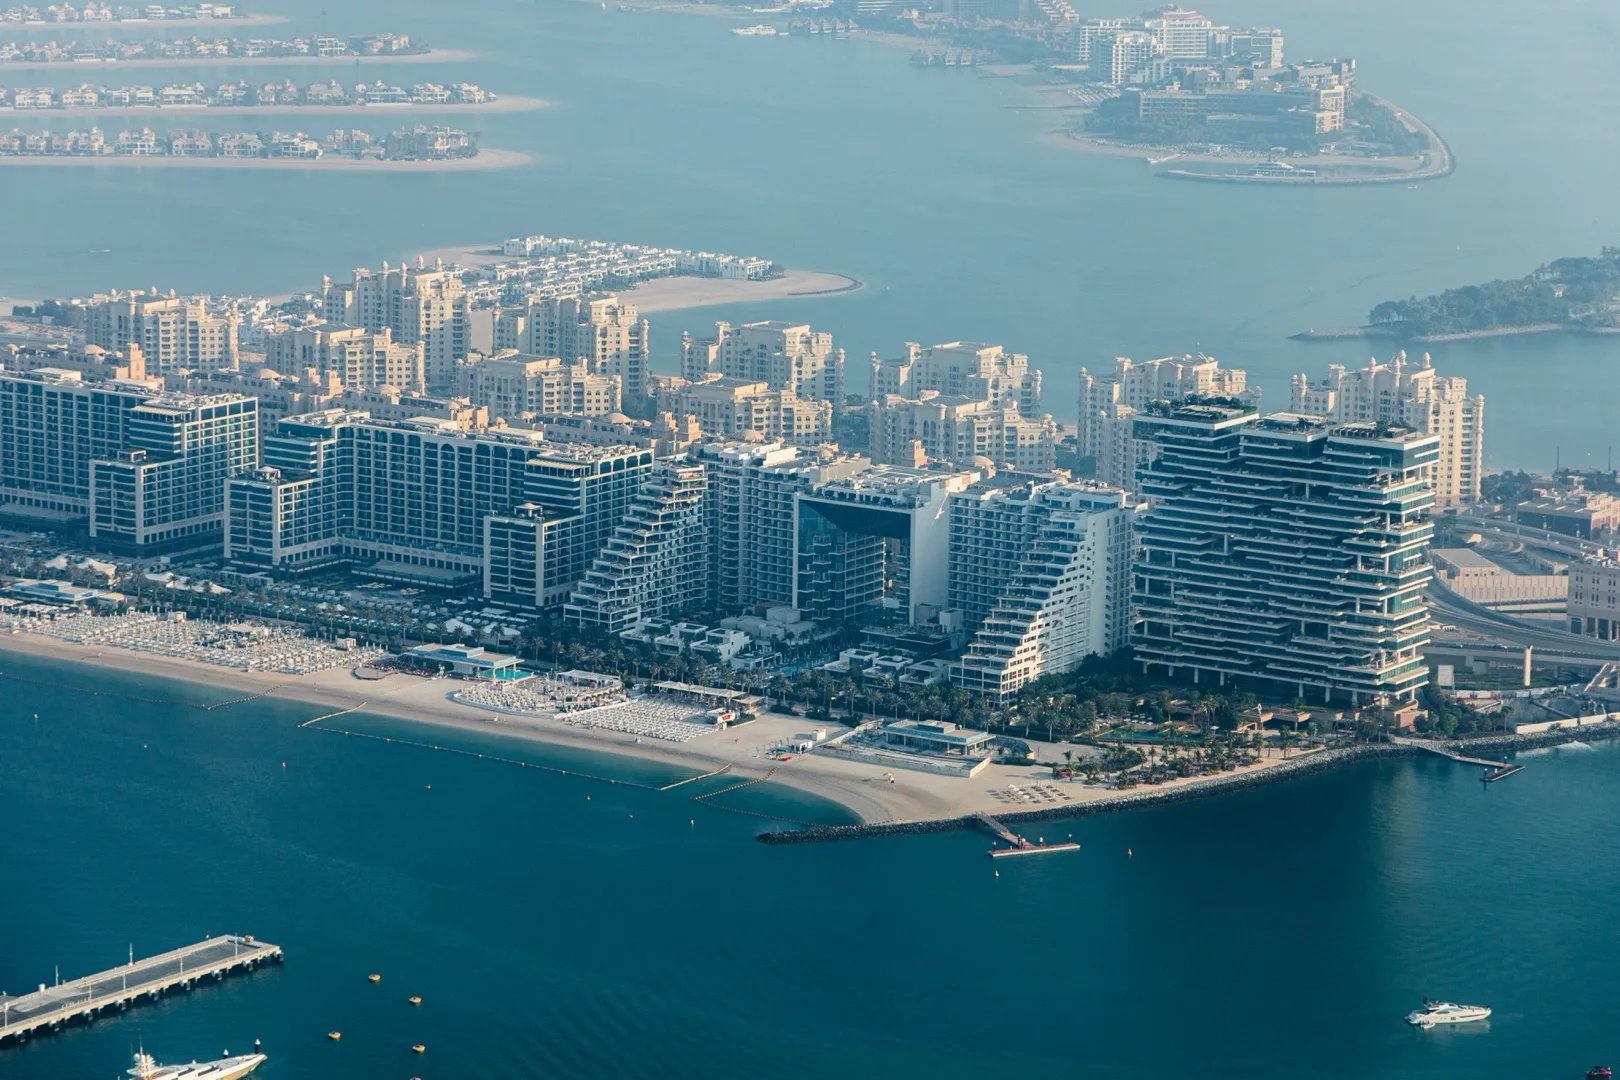
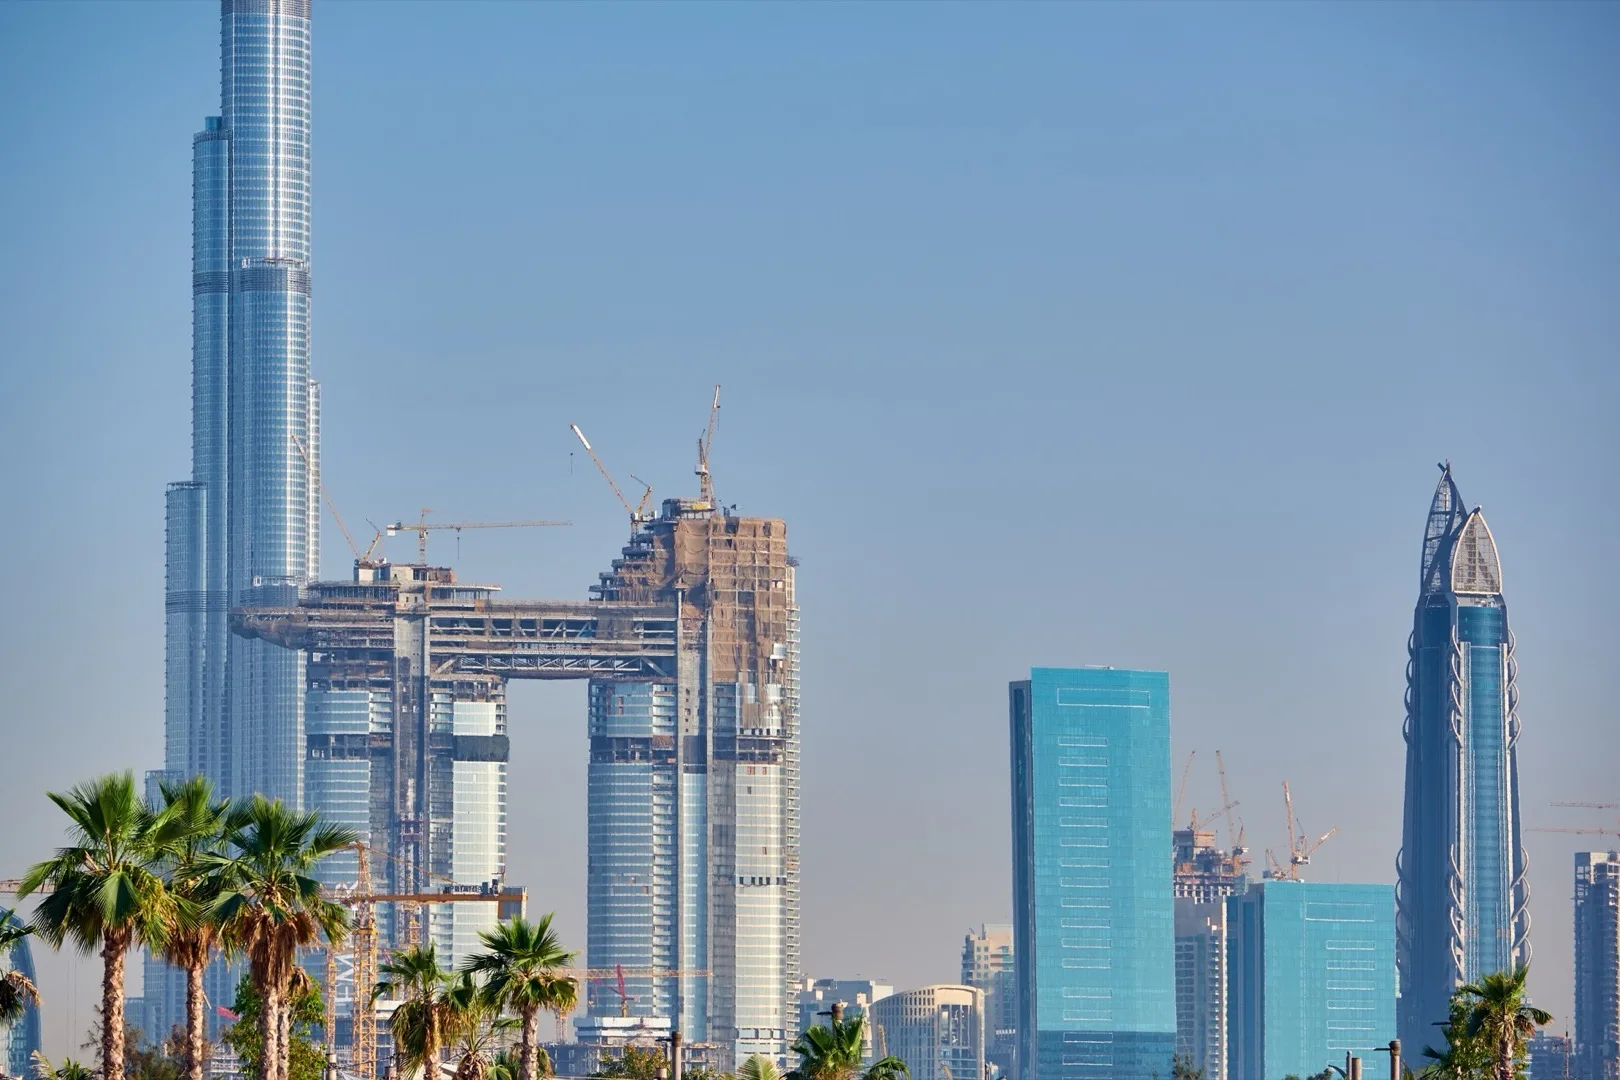
What followed was one of the most extraordinary real estate booms in modern history. Between 2003 and 2008, average property prices in Dubai increased by approximately 300–400%, with some areas recording significantly higher gains. The Palm Jumeirah, launched as an audacious engineering project, sold out its first phase within days. Dubai Marina went from empty sand to a forest of cranes. Downtown Dubai, anchored by the under-construction Burj Khalifa, became the most talked-about real estate address in the world.
Key Drivers
- Freehold legislation: First-mover advantage. Dubai was the first Gulf city to offer foreigners true property ownership, creating massive pent-up demand.
- Oil wealth spillover: High oil prices ($100+ per barrel) flooded the region with capital seeking deployment.
- Easy credit: Banks offered mortgages with 90–95% loan-to-value ratios, minimal documentation, and aggressive lending targets.
- Speculation: Flipping became endemic. Properties were bought and sold multiple times during construction, with each transaction adding 10–20% to the price. Some off-plan units changed hands five or six times before completion.
- Global liquidity: The pre-2008 global credit boom made capital cheap and abundant worldwide, funnelling money into emerging market property.
Warning Signs That Were Ignored
In hindsight, the signals were clear. Transaction volumes began plateauing in mid-2008 while prices continued rising — the classic divergence that precedes a correction. Developer launches accelerated to unsustainable levels, with over 500 active projects at the peak. Mortgage lending growth decelerated months before the crash. And the price-to-rent ratio reached levels that made no economic sense — some properties would have taken 40+ years of rental income to recoup their purchase price.
The 2008–2011 Crash
What Happened
The global financial crisis hit Dubai's property market like a freight train. Between Q3 2008 and Q1 2010, average property prices fell approximately 50–60% from peak levels. Some areas experienced even steeper declines. Off-plan projects were cancelled en masse. Construction stopped on hundreds of buildings, leaving half-finished towers dotting the skyline. Developers defaulted on debt. Speculators who had bought with 10% down payments and 90% leverage lost everything.
The correction was brutal but not uniform. Prime areas like Dubai Marina, Downtown Dubai, and Palm Jumeirah fell 45–55% but retained some floor due to genuine end-user demand. Peripheral locations and speculative developments fell 60–70% and some never recovered — several projects were cancelled entirely and investors lost their deposits.
Duration and Recovery
The trough occurred in approximately Q1–Q2 2011, marking a roughly 2.5-year decline from peak to bottom. The initial recovery was slow — prices rose just 3–5% annually from 2011 to 2012 as the market absorbed excess inventory and investor confidence slowly rebuilt. The lesson was clear: Dubai crashes hard but recovers, provided you bought in quality locations and avoided maximum leverage.
Cycle 2: Recovery and Second Correction (2012–2019)
The 2012–2014 Recovery
Starting in 2012, Dubai entered a robust recovery driven by several factors: the Expo 2020 bid win (November 2013) injected optimism, regional instability in Egypt and Syria pushed capital to Dubai's perceived safe haven, and genuine economic diversification — particularly in tourism, logistics, and finance — created employment growth that supported housing demand.
Prices rose approximately 25–30% between 2012 and 2014, recovering roughly half the ground lost in the crash. Transaction volumes surged. New project launches resumed. International investors returned, with Chinese, Indian, and Pakistani buyers becoming increasingly prominent alongside traditional Gulf, European, and Russian capital.
The 2015–2019 Correction
The recovery peaked in mid-2014 and the market entered a prolonged correction that lasted nearly five years — the longest downturn in Dubai's property history. Unlike the sharp 2008 crash, this was a slow grind lower, with prices declining approximately 25–35% from 2014 peak levels by 2019.
Key Drivers of the 2015–2019 Correction
- Oversupply: Developers launched aggressively during the 2012–2014 recovery, and those units began hitting the market from 2016 onward. Dubai was adding 25,000–35,000 new units annually against absorption capacity of roughly 20,000.
- Oil price collapse: Crude fell from $110 to $30 per barrel in 2014–2016, reducing Gulf liquidity and confidence even though Dubai's direct oil dependency is minimal.
- VAT introduction (2018): The 5% VAT on commercial property and various services added friction to transactions.
- Strong dollar: The AED's peg to the dollar made Dubai expensive for buyers from countries with weakening currencies (India, Pakistan, Russia, Turkey, UK).
- Regional geopolitics: The Qatar blockade, Yemen conflict, and Iran tensions created regional uncertainty.
Cycle 3: The Current Bull Run (2020–Present)
The COVID Dip (2020)
COVID-19 initially triggered panic selling and transaction freezes in Q1–Q2 2020, with prices dipping an additional 5–10% from already-depressed 2019 levels. But Dubai's aggressive reopening strategy — the city was one of the first major global destinations to welcome tourists back — combined with the successful Expo 2020 (held in 2021–2022), catalysed a dramatic recovery.
The 2021–2026 Bull Run
What followed has been the strongest sustained price rally in Dubai's history, surpassing even the pre-2008 boom in terms of transaction volumes (though not yet in cumulative price gains from trough). Key characteristics of this cycle:
| Year | Avg. Price Change | Transaction Volume | Key Catalyst |
|---|---|---|---|
| 2020 | -5% to -10% | 35,000 | COVID dip, aggressive reopening |
| 2021 | +18% to +22% | 60,200 | Expo 2020 opening, visa reforms, remote work migration |
| 2022 | +20% to +28% | 86,000 | Russia-Ukraine war (capital flight), Golden Visa expansion |
| 2023 | +16% to +20% | 133,000 | Population growth acceleration, Chinese buyer return |
| 2024 | +12% to +16% | 163,000 | Continued population growth, off-plan mania |
| 2025 | +8% to +12% | 180,000+ | Market maturation, selective price growth |
| 2026 (YTD) | +5% to +8% | 55,000 (Q1) | Decelerating but positive, supply concerns emerging |
What Is Driving This Cycle?
- Visa and residency reforms: The Golden Visa programme (10-year residency for property investors), remote work visas, retirement visas, and corporate tax-neutral freelance visas have structurally increased the pool of potential residents and property buyers.
- Population growth: Dubai's population has grown from approximately 3.4 million in 2020 to an estimated 4.1 million in 2026 — roughly 700,000 new residents in six years. More people means more housing demand.
- Capital flight: The Russia-Ukraine conflict, Chinese capital controls and COVID policy aftermath, Indian wealth migration, and broader geopolitical uncertainty have driven significant capital to Dubai as a perceived safe haven.
- Remote work migration: Dubai positioned itself as the world's premier remote work destination during and after COVID. Thousands of entrepreneurs, freelancers, and remote employees from Europe, the Americas, and Africa relocated permanently.
- Economic diversification: Unlike 2008, Dubai's economy in 2026 is genuinely diversified. Tourism, logistics, technology, finance, healthcare, and education all contribute to GDP. The dependency on oil-linked sentiment is materially lower.
Cycle Duration Analysis
If we map Dubai's property cycles, a pattern emerges:
| Cycle | Upswing Duration | Peak-to-Trough | Price Decline | Full Cycle |
|---|---|---|---|---|
| 2003–2011 | ~5.5 years | ~2.5 years | -50% to -60% | ~8 years |
| 2012–2019 | ~2.5 years | ~5 years | -25% to -35% | ~7.5 years |
| 2020–present | ~6 years (ongoing) | TBD | TBD | TBD |
The current upswing at approximately six years is already the longest in Dubai's property history. This does not necessarily mean a correction is imminent — cycles do not run on fixed timers — but it does mean we are in statistically unfamiliar territory. Every previous cycle peaked within five years.
Following the Market?
Get Market Data in Your Inbox
DLD transaction data, price trends, and quarterly forecasts — before everyone else.
✓ You're in! Check your inbox.
Leading Indicators: What to Watch
Markets do not crash without warning. In every previous Dubai downturn, leading indicators deteriorated 6–12 months before prices turned. Here are the indicators that matter most, ranked by reliability:
1. Transaction Volume Divergence (Most Reliable)
In both 2008 and 2014, transaction volumes began declining while prices continued rising. This divergence — fewer buyers paying higher prices — is the single most reliable warning sign. When monthly transaction counts drop 15%+ year-on-year while prices are still rising, the correction is typically 6–12 months away. Currently, Q1 2026 volumes remain at record levels but the growth rate is decelerating.
2. Mortgage Approval Rates
Mortgage data lags transaction data but provides confirmation. When banks begin tightening lending standards or approval rates decline, it signals that financial institutions see elevated risk. The Central Bank's LTV restrictions introduced in 2013 (capping mortgages at 80% for first homes, 60% for off-plan) were a regulatory response to cycle risk. If you are considering financing, review our mortgage guide for current lending conditions.
3. Developer Launch Frequency
Developers are procyclical — they launch projects aggressively when the market is hot and retreat when it cools. An acceleration in new project launches, particularly in peripheral areas and from smaller developers, indicates the market is approaching peak optimism. In 2025–2026, new project launches have hit record levels, which warrants careful monitoring.
4. Visa and Population Data
Dubai's property demand is fundamentally driven by population growth. If visa issuance, residency permits, and population growth decelerate, property demand will follow. This is the most important structural indicator — and currently the most reassuring. Dubai's population growth remains robust with no signs of deceleration through Q1 2026.
5. Off-Plan to Ready Ratio
When off-plan transactions dominate the market (above 60–65% of total volume), it often indicates speculative activity. Speculators prefer off-plan because of low down payments and the ability to flip before handover. Currently, off-plan transactions represent approximately 60% of total volume — approaching but not exceeding previous cycle warning levels.
Is This Time Different? The Structural Shift Argument
"Is this time different?" are the four most dangerous words in investing. But intellectual honesty requires considering the argument.
Arguments That This Cycle Is Structural, Not Speculative
- Regulatory maturity: RERA regulation, escrow requirements, LTV caps, and mandatory defect liability periods create a fundamentally different regulatory environment than 2008. The Wild West era is over.
- Population trajectory: Dubai's government targets a population of 5.8 million by 2040. If achieved, this creates sustained structural demand for roughly 30,000 new housing units annually — close to what the market currently produces.
- Economic diversification: In 2008, Dubai's economy was heavily dependent on construction and real estate. In 2026, the economy is genuinely diversified across tourism, logistics, finance, technology, healthcare, and education.
- Golden Visa sticky capital: The Golden Visa programme creates "sticky" property ownership — holders are incentivised to maintain their property investment for residency purposes, reducing panic selling during downturns.
- Global city status: Dubai has graduated from "emerging market curiosity" to "global city peer" alongside London, Singapore, Hong Kong, and New York. Global city property markets are less cyclical than emerging markets.
Arguments That Cycles Always Repeat
- "It's different this time" was said in 2007 too. The pre-2008 boom also had structural narratives — freehold legislation, economic diversification, Gulf hub status. None of them prevented a 60% crash.
- Supply pipeline: Over 70,000 residential units are scheduled for delivery in 2026–2028. If even 60% of these materialise, the supply wave could temporarily exceed absorption, particularly in the affordable and mid-market segments.
- External risks: A global recession, a sudden tightening of US monetary policy (which constrains the UAE via the dollar peg), or geopolitical escalation in the region could trigger capital outflows regardless of structural improvements.
- Speculation markers: Postdated cheque flipping, secondary market premiums on off-plan assignments, and social media "property millionaire" influencers are all hallmarks of late-cycle excess.
Practical Implications for 2026–2028
Given this analysis, how should investors position themselves?
For New Buyers
The window for aggressive buying has narrowed but not closed. Focus on areas with genuine demand drivers (proximity to employment, transport infrastructure, lifestyle amenities) rather than speculative hype. Avoid peripheral off-plan projects from unknown developers. If you are buying for the first time, our step-by-step buying guide covers the process in detail.
For Existing Owners
If you own property purchased during the 2020–2021 trough, you are sitting on substantial unrealised gains. Consider whether your current allocation is appropriate for a late-cycle environment. Diversification across areas and property types reduces downside risk. Use the ROI calculator to evaluate whether your current returns justify holding versus redeploying capital.
For Income Investors
Rental yields have compressed as capital values have risen faster than rents. Average yields in premium areas have fallen from 7–8% in 2021 to 5–6% in 2026. Focus on areas where rental demand remains structurally strong — communities near metro stations, employment hubs, and schools. Check our highest ROI areas ranking for current yield data.
For Speculators
Late-cycle speculation carries elevated risk. Off-plan flipping that generated 20–30% returns in 2022–2023 is producing 5–10% in 2026 as secondary market premiums compress. If you are flipping, maintain strict discipline on exit prices and never hold positions that require ongoing price appreciation to break even.
What Would a 2027–2028 Correction Look Like?
If a correction occurs, it is more likely to resemble 2015–2019 (gradual, -20% to -30%, 3–4 years) than 2008 (-60%, sharp and sudden). The regulatory improvements, lower leverage in the system, and Golden Visa sticky capital all argue against a 2008-style crash. However, a 20–30% correction over 2–3 years is entirely plausible if the supply pipeline delivers as scheduled and global economic conditions deteriorate.
The areas most vulnerable to correction are those with the heaviest new supply and weakest fundamental demand — peripheral off-plan communities with minimal transport access, employment proximity, or lifestyle amenities. Prime areas with constrained supply (Palm Jumeirah, Downtown Dubai, established villa communities like Arabian Ranches) tend to outperform during downturns due to limited new supply and genuine end-user demand.
Frequently Asked Questions
Is the Dubai property market going to crash in 2027?
No one can predict the timing of a correction with certainty. The data shows that we are in a late-cycle phase — the longest sustained upswing in Dubai's history — and leading indicators (decelerating volume growth, rising supply pipeline, off-plan dominance) suggest elevated risk. However, structural factors (population growth, visa reforms, economic diversification) provide genuine support. A gradual correction of 15–25% is more probable than a sharp crash, and the timing could be anywhere from late 2026 to 2029.
How long do Dubai property downturns typically last?
The two completed downturns lasted approximately 2.5 years (2008–2011) and 5 years (2015–2019). The sharper the crash, the faster the recovery. The 2008 crash was more violent but recovered more quickly, while the 2015–2019 correction was gentler but prolonged. A future correction is likely to fall somewhere in between — perhaps 2–3 years of price declines followed by 1–2 years of stabilisation before the next growth phase.
Should I wait for a correction before buying?
Timing the market perfectly is nearly impossible. Investors who waited for a correction during 2021–2023 missed 40–60% price appreciation. The better approach is to buy quality assets in strong locations at reasonable prices, with a long-term hold horizon (5+ years) and conservative financing. If you buy in a prime area today and a 20% correction occurs, you will likely be above your purchase price within 3–5 years based on historical recovery patterns.
Which areas are most resilient during Dubai downturns?
Prime, supply-constrained areas consistently outperform during corrections. Palm Jumeirah, Downtown Dubai, Dubai Marina, Emirates Hills, and established villa communities show smaller declines and faster recoveries than peripheral apartment-heavy developments. The common thread is limited new supply, genuine end-user demand, and strong lifestyle appeal. During the 2015–2019 correction, Palm Jumeirah fell approximately 20% while some peripheral areas fell 40%+.
How does the off-plan supply pipeline affect the cycle?
The supply pipeline is the single biggest risk factor for the current cycle. Over 70,000 units are scheduled for delivery in 2026–2028, but historically only 50–60% of announced projects are delivered on schedule. If completion rates are higher than usual (due to developer discipline improvements), the supply wave could temporarily exceed absorption, particularly in areas like JVC, Dubai South, and MBR City where multiple large projects are completing simultaneously. Our Q2 2026 market forecast covers the supply pipeline in detail.
Does the Golden Visa change how market cycles work?
The Golden Visa is a genuinely new structural element. By tying residency to property ownership, it creates "sticky" capital — owners have a strong incentive to maintain their property investment even during downturns, reducing panic selling. This should make corrections gentler and recoveries faster than in previous cycles. However, the Golden Visa does not eliminate cycles entirely — it changes the amplitude, not the direction.
Want a Data-Backed Second Opinion?
Tell us your plans — we'll share what the data says about your timing.
Thank You!
We'll get back to you within 24 hours.
Real Estate Agencies in Dubai
Explore providers from our business directory
Still have questions?
Ask a follow-up, or get connected with a vetted Dubai professional.
Follow us on LinkedIn
Dubai market analysis and industry insight for professionals.