Oil Prices, OPEC+ Cuts and Dubai Property: The Real Correlation in 2026

- Dubai's economy is now roughly 99% non-oil. The oil-direct contribution to Dubai GDP has been around 1% or less for the better part of a decade — Abu Dhabi carries the UAE's hydrocarbon weight, not Dubai.
- The historical correlation between Brent crude and Dubai residential prices was strong from 2002 to about 2014, weaker through 2014-2017, and visibly partial since 2017 — driven by tourism, financial services, logistics and expat demand from non-oil economies.
- OPEC+ supply decisions still matter for Dubai property, but mostly through indirect channels: Gulf liquidity, sovereign wealth deployment, GCC investor confidence, MENA expat hiring and regional risk premium.
- Foreign buyer flows into Dubai are dominated by India, the UK, the EU, China and increasingly Russia and the CIS — economies whose income is not primarily oil-linked. Saudi and Kuwaiti buyers remain important but no longer dominant.
- The dirham peg to the US dollar via the UAE Central Bank is the single most important monetary anchor for Dubai property — not the oil price. Federal Reserve policy transmits faster than OPEC+ headlines.
- Dubai is not oil-immune. A multi-year slump below USD 50 per barrel still hurts via construction inputs, regional sentiment and the federal budget. The relationship is partial, not absent.
- Investors should treat oil headlines as a sentiment signal, not a price-prediction tool. Watch transaction volumes, mortgage approval rates, RERA index movement and DLD foreign-buyer mix instead.
Every time OPEC+ holds a meeting, every time Brent crude swings five dollars in either direction, the same headline reappears: oil prices and Dubai property. The narrative is intuitive. The Gulf is oil. Dubai is in the Gulf. Therefore Dubai property must follow oil. And for a long stretch of the early 2000s, that narrative was broadly correct — although even then the relationship was looser than most analysts assumed.
In 2026, the relationship is materially different. Dubai's economy has structurally diversified. The buyer base has globalised. The dirham is anchored to the US dollar, not to Brent. And the city's property market has demonstrated, across at least three full cycles, that it can move independently of the oil price for years at a time. The oil-Dubai correlation is real, but it is partial, lagged and increasingly indirect.
This article is a data-led look at how oil prices and OPEC+ supply decisions actually affect Dubai real estate in 2026 — including the channels that matter, the channels that do not, and what investors should watch when oil headlines drive sentiment.
UAE GDP Composition: Why Dubai Is Not Abu Dhabi
The single biggest source of confusion in this debate is that observers conflate "UAE" with "Dubai." They are not the same economy. The UAE federation contains seven emirates, and the oil weight is concentrated overwhelmingly in Abu Dhabi. Federal-level UAE GDP figures look hydrocarbon-heavy because Abu Dhabi sits inside them. Dubai's standalone GDP composition tells a very different story.
Based on figures published by the Dubai Statistics Centre and the UAE Ministry of Economy across multiple years, the rough composition of UAE GDP and Dubai GDP looks like this in 2026:
| Sector | UAE Federal (approx. share) | Abu Dhabi GDP (approx.) | Dubai GDP (approx.) |
|---|---|---|---|
| Oil & gas (extraction) | 25-30% | 45-55% | ~1% or less |
| Wholesale & retail trade | 10-13% | 5-7% | 23-26% |
| Transport & logistics | 7-9% | 3-5% | 11-13% |
| Financial services | 8-10% | 5-7% | 11-13% |
| Real estate & construction | 12-14% | 8-10% | 14-17% |
| Manufacturing | 8-10% | 6-8% | 8-10% |
| Tourism, hospitality, F&B | 5-7% | 3-5% | 8-11% |
| Other (gov, ICT, prof. services) | balance | balance | balance |
The point is not the precise decimal — these shares move year to year and different agencies compile them differently — but the structural picture: Abu Dhabi is roughly half oil, Dubai is roughly one percent oil. Dubai's economic engine is trade, logistics, real estate, tourism, financial services and increasingly technology. When OPEC+ cuts supply by half a million barrels per day, Abu Dhabi's federal contribution and sovereign reserves move materially. Dubai's restaurants, hotels, airports and shopping malls largely do not.
This is the foundation for everything that follows. If Dubai's economy is overwhelmingly non-oil, the oil price cannot be a primary driver of Dubai property in the way it might be a primary driver of Riyadh, Doha or Kuwait City property.
The Historical Record: Brent vs Dubai Property Across Five Cycles
The cleanest way to test the oil-Dubai narrative is to look at what actually happened across multiple oil cycles since the global financial crisis. The pattern is more complicated than the headline view suggests.
| Period | Brent Range (USD/bbl) | Dubai Property Direction | Notes |
|---|---|---|---|
| 2007-2008 | ~70 rising to ~140, then collapse | Boom then severe correction | Property crash driven mostly by global credit crisis and Dubai-specific leverage, not oil itself |
| 2010-2014 | ~80 to ~110 | Strong recovery and re-pricing | Recovery aligned with high oil prices and Expo 2020 win |
| 2014-2017 | ~110 collapsing to ~30, recovering to ~55 | Soft correction, then sideways | Correction milder than oil collapse implied; partial decoupling first visible here |
| 2018-2019 | ~50 to ~80 range | Continued price softness | Oversupply (not oil) drove the late-cycle weakness |
| 2020 (Covid) | Brief negative WTI; Brent ~20-45 | Short, sharp dip then V-shaped recovery | Recovery began long before oil normalised — Dubai responded to lockdown easing, expat inflows |
| 2021-2024 | ~70 to ~120, settling ~75-85 | Multi-year boom across most segments | Boom driven by remote work, Russian/CIS inflows, Golden Visa, Expo legacy — not oil |
| 2025-2026 | Range-bound ~70-90 | Stabilising / segment-dependent | Mid-market resilient; ultra-prime moderating from 2024 highs |
Two patterns stand out. First, the 2008-2009 crash and the 2020 dip both coincided with oil weakness, but in both cases the proximate cause was global — a credit crisis and a pandemic respectively. Oil was a passenger in those moves, not the driver. Second, the 2014-2017 oil collapse from USD 110 to USD 30 produced only a soft, drawn-out Dubai correction, and the 2021-2024 boom occurred during a period of mid-range oil prices, not record highs. The relationship is partial.
For investors who want to track the rental side of these cycles in real time, the RERA rental index is a far more useful instrument than the Brent chart.
How OPEC+ Decisions Actually Reach Dubai Property
OPEC+ supply decisions do affect Dubai, but mostly through indirect channels. Understanding these channels is the difference between trading on headlines and reading the market accurately.
1. Gulf Liquidity and Sovereign Wealth Deployment
Higher oil revenues swell the budgets and reserves of GCC governments and sovereign wealth funds. Some of that liquidity ultimately reaches Dubai through infrastructure spending, intra-GCC investment flows, regional bank balance sheets and high-net-worth deployment into Dubai property by GCC nationals. The lag is typically 6-18 months and the effect is concentrated in the prime and ultra-prime segments rather than the mid-market.
2. GCC Investor Confidence
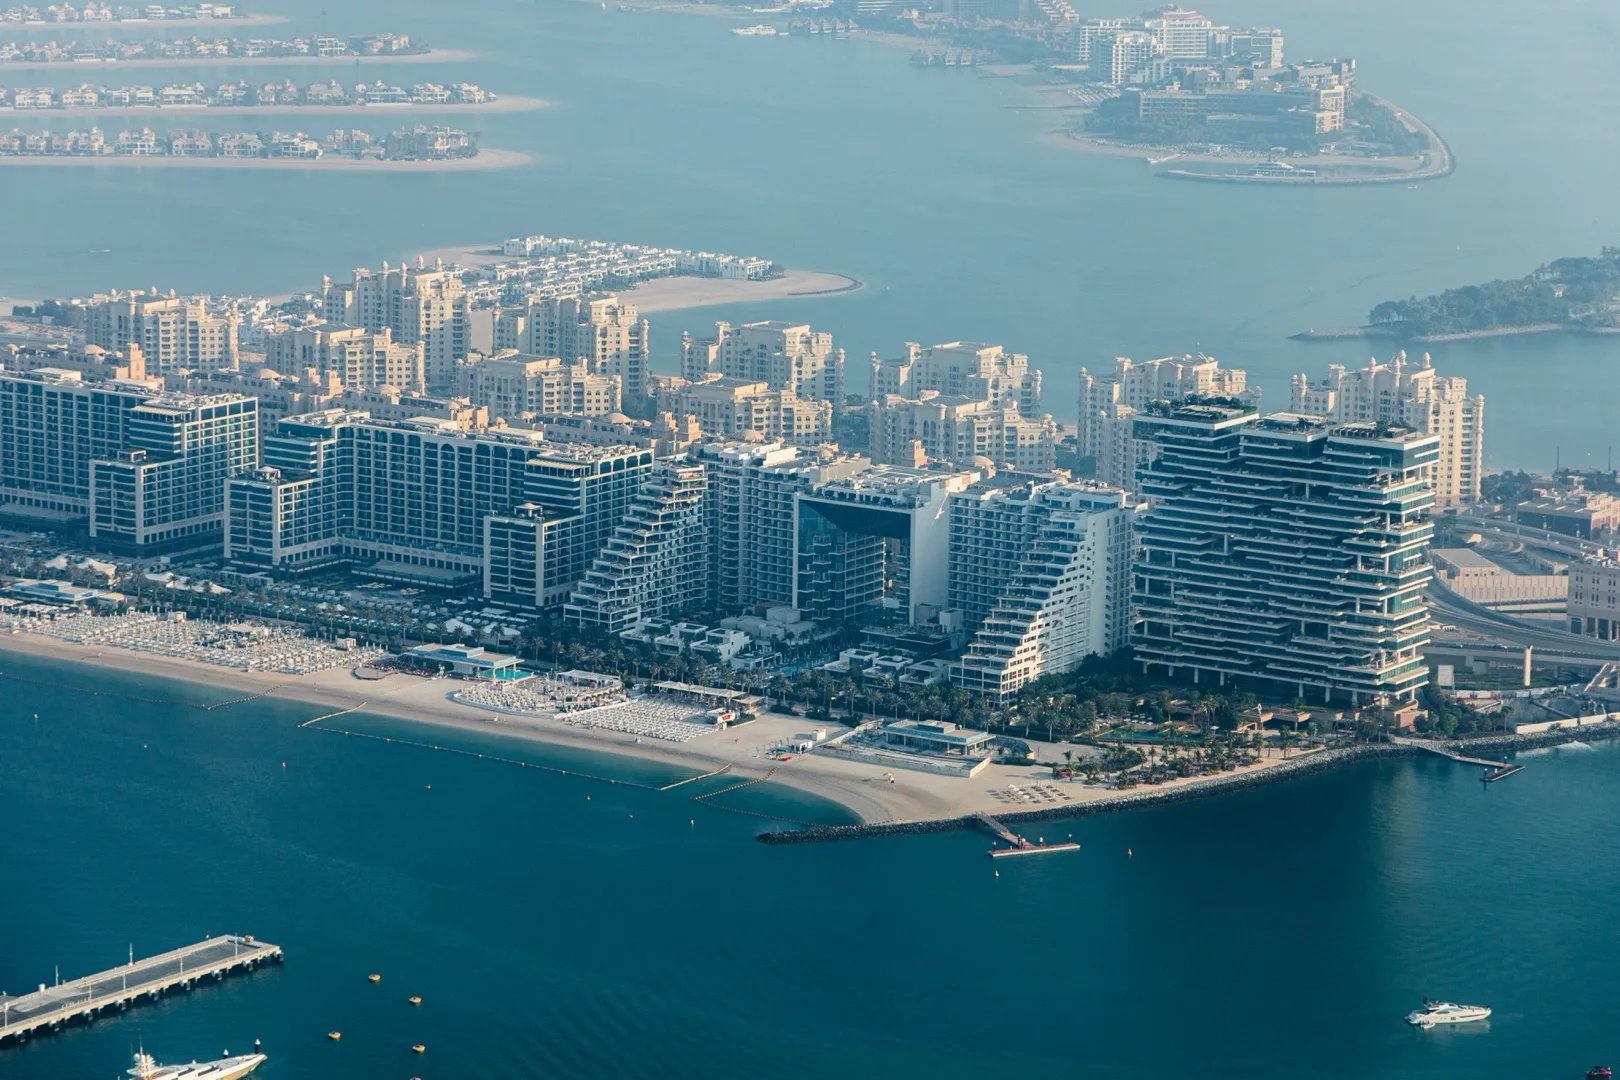
Saudi, Kuwaiti, Qatari and Bahraini buyers remain meaningful in Dubai's prime segments — particularly Palm Jumeirah, Downtown and Emirates Hills. When oil revenues are strong and regional confidence is high, these buyers are more active. When oil weakens persistently, they pull back. This effect is real but smaller than it was a decade ago because the buyer pool has globalised. For a sense of how the prime market behaves, see our Palm Jumeirah area guide.
3. MENA Expat Hiring
Many Dubai-based companies serve clients across Saudi Arabia, Iraq, Egypt and the wider region. When regional oil revenues fall, project pipelines shrink, and Dubai-based staffing of those projects is the first to be cut. This affects mid-market rents and apartment demand more than it affects villa or ultra-prime values.
4. Construction Input Costs
Diesel, asphalt, polymer-based building materials and shipping costs all carry an oil component. When oil rises sharply, developer margins compress and handover schedules can slip. When oil falls, construction becomes cheaper but developers do not necessarily pass the saving through to off-plan buyers.
5. Federal Budget and Infrastructure Pace
The UAE federal budget is partly funded by Abu Dhabi's oil receipts. Sustained low oil reduces the pace of federal infrastructure deployment, which over time can affect emirate-level project timelines. This is a slow-moving, multi-year channel, not a headline-day mover.
6. Regional Risk Premium
Sharp oil moves often coincide with geopolitical events — Russia-Ukraine, Red Sea shipping disruptions, regional tensions — and those events reset the risk premium that international buyers assign to the entire Gulf. Counterintuitively, periods of regional risk have often produced inflows into Dubai as a relative safe haven, not outflows.
The Channel That Actually Matters: The Dirham, the Dollar and the Fed
If there is one monetary variable that drives Dubai property more than the oil price, it is the US Federal Reserve. The UAE dirham is pegged to the US dollar at AED 3.6725 per USD via the UAE Central Bank, and that peg has held for decades. The practical consequence is that UAE benchmark interest rates track Fed policy almost in lock-step.
When the Fed raises rates, UAE mortgage rates rise within days. When the Fed cuts, UAE mortgage rates fall. This is the channel that moves transaction volumes, off-plan absorption, mortgage approvals and refinancing activity in Dubai. Oil prices feed into this only indirectly — for example by shaping global inflation expectations, which then shape Fed decisions.
For a current view of how the rate environment translates into mortgage costs, see our Dubai mortgage rates comparison for 2026 and the underlying UAE LTV rules. These are far more actionable than tracking OPEC+ meetings.
Foreign Buyer Origin: Increasingly Non-Oil
The other major reason Dubai property has decoupled from oil is the changing buyer base. Dubai Land Department data on foreign buyer nationalities, summarised across recent years, shows a clear shift away from GCC dominance and toward a global buyer pool — much of which earns its income in non-oil economies.
| Buyer Origin | Approx. Share of Foreign Buyers | Income Linked to Oil? | Notes |
|---|---|---|---|
| India | High (top 1-2 most years) | Indirect / minimal | Tech, finance, trade, family-business wealth |
| United Kingdom | High | No | Services-economy income, often retirement / lifestyle buyers |
| EU (Germany, France, Italy, Netherlands) | Meaningful and growing | No | Lifestyle, second-home, tax planning |
| Russia and CIS | Risen materially since 2022 | Mixed (Russia partial, CIS less so) | Capital flight, sanctions-driven relocation |
| China | Meaningful | No | Manufacturing, trade, capital-controls bypass |
| Saudi Arabia | Meaningful, prime-skewed | Yes | Most direct oil-linked buyer cohort |
| Pakistan, Egypt, Lebanon, Jordan | Meaningful, mid-market | Indirect | Diaspora and regional service-economy buyers |
| Turkey, Iran (where permitted), other MENA | Growing | Mixed | Currency / political diversification |
The composition of this buyer mix means a sustained oil downturn would be a partial headwind for Dubai prime property — not a system-wide collapse. The mid-market in particular is now driven by demand from people whose paychecks are denominated in rupees, pounds, euros and dollars, not in Brent crude.
Following the Market?
Get Market Data in Your Inbox
DLD transaction data, price trends, and quarterly forecasts — before everyone else.
✓ You're in! Check your inbox.
What a Sustained Oil Slump Would Actually Do
It is worth being honest about the downside scenario. If oil were to settle below USD 50 per barrel for 18-24 months and OPEC+ failed to defend a higher band, what would happen to Dubai property in 2026?
Probable outcomes:
- Prime and ultra-prime values soften by a single-digit to low-double-digit percentage as GCC and Russian-CIS demand thins.
- Mid-market and emerging-community values stay broadly resilient, supported by ongoing Indian, UK, EU and South Asian inflows.
- Off-plan launches slow, particularly at the luxury end, and developers lengthen payment plans to keep velocity. See our guide to off-plan payment plans for how this typically plays out.
- Rental yields hold or improve in mid-market areas because rents are more sticky than capital values.
- Federal infrastructure pace moderates, but emirate-level projects continue.
Unlikely outcomes:
- A 2008-style 40-50% market-wide crash. The leverage profile is fundamentally different in 2026 — LTV caps are tighter, off-plan cash buyers are more common, the speculative flipping era of the early 2000s is structurally constrained.
- A collapse in expat population. Dubai's non-oil sectors continue to hire, and a weaker oil price actually helps regional consumers via cheaper fuel.
- A peg break. The dirham peg has been defended through far more severe oil cycles than anything plausible in 2026.
The realistic downside is a soft, segment-specific correction at the prime end, not a system-wide event. For investors who care about which areas weather these moves best, see our analysis of best areas in Dubai for capital appreciation and highest ROI areas ranked by rental yield.
What Investors Should Actually Watch
If oil-OPEC+ headlines are a poor proxy for Dubai property direction, what should serious investors track instead? A short list of high-signal indicators:
- DLD transaction volumes (monthly). Volume leads price by a few months. Sustained volume strength is a more reliable bullish signal than any oil headline.
- Mortgage approval rates and benchmark rates (EIBOR). These move with Fed policy, not OPEC+. They drive affordability for the resident buyer cohort.
- RERA rental index movement. Rents are stickier than capital values and reveal underlying demand more honestly. Use the REC ROI Calculator to model your own assumptions.
- Foreign buyer mix from DLD. A widening, more diversified mix is structurally bullish; a narrowing mix is a warning.
- Off-plan absorption rates. If new launches are absorbing inside 60-90 days, sentiment is healthy. If they sit for six months, sentiment is rolling over.
- Visa and residency policy. Golden Visa and remote-worker visa expansions are demand-creating. See our Golden Visa 2026 update.
- Tourism arrivals. Dubai's hospitality sector underwrites short-term-rental demand, which in turn supports investor yields.
- Federal Reserve guidance. The single most important monetary input.
Track these and you will read the Dubai market accurately. Track Brent crude alone and you will be early or late more often than you are right.
Honest Framing: Dubai Is Less Oil-Correlated, Not Oil-Immune
The honest framing is somewhere between the two extremes. Dubai is not Riyadh or Kuwait City — its economy is genuinely diversified, its buyer base is genuinely global, and its monetary anchor is the US dollar, not Brent. The oil-Dubai narrative is overstated.
But Dubai is not Singapore either. It sits inside a region whose largest economies are oil-dependent. Sustained, severe oil weakness over multiple years would still register, particularly at the prime end, in regional sentiment, and in federal-level infrastructure pacing. Investors who tell themselves Dubai is fully decoupled are flattering the market.
The accurate position: Dubai property in 2026 is partially correlated with oil — most strongly at the prime/ultra-prime end, most weakly in the mid-market — and the correlation has been declining for nearly a decade. OPEC+ headlines are sentiment events, not price-prediction tools.
Where Oil Headlines Still Move Sentiment
Even if the fundamental linkage is weak, the sentiment linkage is real. Two specific cases where OPEC+ news visibly moves Dubai market chatter:
Big surprise cuts that shock crude higher. When OPEC+ delivers an unexpected cut and Brent jumps USD 5-10 in a session, GCC investor confidence improves measurably and prime listings see more enquiries within the same month. The effect is real but small relative to longer-term drivers.
Failed agreements and market-share wars. When OPEC+ fractures and a Saudi-Russia-style price war breaks out, Dubai prime sentiment cools fast even before any fundamental impact appears. This is a sentiment trade, not a fundamentals trade — and it tends to reverse within 1-2 quarters as the headlines normalise.
For investors with conviction, oil-shock-driven sentiment dips have historically been opportunity windows in Dubai mid-market property, not exit signals. The flipping guide and non-resident buying guide both discuss how to act on these windows without overpaying.
Frequently Asked Questions
Are Dubai property prices linked to oil prices in 2026?
Partially, and decreasingly. Dubai's economy is now roughly 99% non-oil, and its buyer base is dominated by non-oil economies (India, UK, EU, China, Russia/CIS). Oil prices still affect Dubai property through indirect channels — Gulf liquidity, GCC investor confidence, MENA expat hiring, construction inputs, regional risk premium — but the direct correlation is weak. The dirham's peg to the US dollar means the Federal Reserve matters more for mortgage costs and transaction volumes than OPEC+ does.
If OPEC+ cuts production sharply, will Dubai property go up?
Not necessarily, and rarely directly. A surprise OPEC+ cut typically improves GCC investor sentiment with a 6-18 month lag, and the effect is concentrated in prime and ultra-prime segments. Mid-market Dubai property — where most foreign retail investors operate — is driven much more by Federal Reserve policy, expat hiring, tourism and visa-policy changes than by OPEC+ decisions.
Did Dubai property crash when oil collapsed in 2014-2017?
Brent fell from roughly USD 110 to USD 30 over that period. Dubai residential prices softened gradually through 2015-2017 but did not crash — the correction was milder than oil's collapse implied. This was the period when partial decoupling first became visible. Several other factors contributed to the soft correction (oversupply, post-Expo-bid normalisation), so the oil component was a contributor, not the sole cause.
Why did Dubai property boom in 2021-2024 with oil at moderate levels?
Because the boom was driven by remote-work flexibility, Russian and CIS capital inflows after 2022, the Golden Visa expansion, post-Expo legacy demand, and a wave of high-net-worth relocations from London, Singapore, Hong Kong and Mumbai. Brent ranged USD 70-120 over those years, but the property boom would have happened at most plausible oil levels because the demand drivers were structural, not commodity-driven.
Is Abu Dhabi property more oil-correlated than Dubai property?
Yes. Abu Dhabi's economy is roughly 45-55% oil and gas, its sovereign wealth deployment is more directly tied to hydrocarbon receipts, and its prime buyer pool skews more regional. Abu Dhabi property is a more direct play on Gulf oil revenues than Dubai property is. That said, Abu Dhabi's market has its own diversification programme and is also less oil-correlated than Riyadh or Kuwait City.
What single indicator should I watch instead of the oil price?
The Federal Reserve's policy path. Because the dirham is pegged to the US dollar, UAE benchmark rates track Fed rates almost one-for-one. Mortgage affordability, off-plan absorption, refinancing activity and transaction volumes are all far more sensitive to Fed decisions than to OPEC+ decisions. The DLD monthly transaction volume is the second-best single indicator.
Could a sustained oil slump cause a Dubai property crash?
A 2008-style market-wide crash is unlikely because the structural setup is different — tighter LTV caps via the UAE Central Bank, a more diversified buyer base, more equity-rich off-plan purchasing, and a non-oil economy. A multi-year oil slump below USD 50 would more plausibly produce a soft, segment-specific correction at the prime end of 5-15%, not a system-wide event.
Where can I see official UAE oil and economic data?
For UAE-level macro data, the UAE Government portal and the UAE Central Bank publish quarterly statistics. For Dubai-level GDP composition, the Dubai Statistics Centre publishes annual breakdowns. For OPEC+ supply decisions and the official global oil supply picture, the Organization of the Petroleum Exporting Countries publishes monthly market reports at opec.org.
The macro picture matters, but most of the actual return in Dubai property comes from picking the right area, the right developer, the right floor plan and the right financing structure. Our REC analysts publish monthly Dubai market reads inside the community — covering DLD volumes, mortgage rates, RERA index moves, and how OPEC+ and Fed events are actually showing up in transaction data. Join the conversation, ask the questions you cannot easily Google, and get a clearer view than any single oil chart will give you.
Want a Data-Backed Second Opinion?
Tell us your plans — we'll share what the data says about your timing.
Thank You!
We'll get back to you within 24 hours.
Real Estate Agencies in Dubai
Explore providers from our business directory
Still have questions?
Ask a follow-up, or get connected with a vetted Dubai professional.
Follow us on LinkedIn
Dubai market analysis and industry insight for professionals.