Dubai Property Prices per Square Foot 2026: AED 700–8,070 — Every Area in One Table

- The city-wide average is roughly AED 1,916 per sq ft (about USD 522) across transactions from 1 January to early June 2026, per Property Monitor data built on DLD records — apartments average AED 1,969, townhouses AED 1,371 and villas AED 2,241 per sq ft.
- The spread between areas is enormous: International City apartments transact around AED 700–850 per sq ft while Palm Jumeirah villas average AED 8,070 and Emirates Hills is quoted around AED 14,500 — a gap of more than 10x within one city.
- Q1 2026 saw AED 176.7 billion in sales across nearly 48,000 transactions, up 23.4% in value year-on-year, with residential averaging AED 1,949 per sq ft per Gulf News-reported brokerage data.
- The measurement gotcha: Dubai prices per sq ft are quoted on built-up area (BUA), not the space you can actually furnish — net usable area is typically only 70–85% of BUA.
- 2025's fastest per-sq-ft growth came from the budget and mid tiers, not prime: Dubai Silicon Oasis +28.5%, Arabian Ranches 3 +27.8%, Dubailand +23.5% and Al Furjan +22.5%, per Bayut's annual report.
- Off-plan now trades above ready stock on a per-sq-ft basis — off-plan apartments averaged around AED 2,100 per sq ft in Q1 2026 — so "new" carries a measurable premium.
- All USD conversions in this article use the fixed AED–USD peg of 3.6725.
Ask five brokers what Dubai property costs per square foot and you will get five confident, different answers — because each is quoting a different area, a different property type and often a different measurement basis. The honest answer is a table, not a number. Dubai's residential market in 2026 spans from roughly AED 700 per sq ft in International City to north of AED 8,000 per sq ft for Palm Jumeirah villas, and where an area sits in that spread tells you more about what you are buying than almost any other single metric.
This article is that table. We have pulled the area-by-area averages from transaction-based sources — Property Monitor's DLD-derived 2026 data, Bayut's full-year 2025 market report and Q1 2026 brokerage analyses — into one reference page: apartments and villas separately, USD conversions included, with the 2025-to-2026 trend per segment and the measurement trap (BUA versus net area) that quietly distorts most per-sq-ft comparisons. Every figure is attributed to its source and data period, because in a market moving this fast, an unattributed number is a useless one. Last updated: June 2026.
The 2026 City-Wide Baseline
Start with the anchor numbers. Across all residential transactions recorded between 1 January and early June 2026, Dubai's overall average is approximately AED 1,916 per sq ft (USD 522), according to Property Monitor data compiled by Engel & Völkers from Dubai Land Department transaction records. By property type, the same dataset splits as follows:
| Property type | Avg AED / sq ft (H1 2026) | Approx USD / sq ft |
|---|---|---|
| Apartments | AED 1,969 | USD 536 |
| Townhouses | AED 1,371 | USD 373 |
| Villas | AED 2,241 | USD 610 |
| All residential | AED 1,916 | USD 522 |
Source: Property Monitor / DLD transaction data, 1 January – 6 June 2026, via Engel & Völkers. USD at the fixed AED 3.6725 peg.
The first-quarter picture confirms the momentum behind those averages. Q1 2026 closed at AED 176.7 billion in total sales across nearly 48,000 transactions — up 23.4% in value and 5.5% in volume year-on-year — with the residential segment alone averaging AED 1,949 per sq ft, per fäm Properties and Springfield Properties data reported by Gulf News. Two details inside that report matter for per-sq-ft thinking: off-plan apartments averaged around AED 2,100 per sq ft, and secondary-market villas around AED 2,354 per sq ft. In other words, off-plan now trades at a premium to ready stock on a per-foot basis — buyers are paying extra for new inventory and payment plans, not getting a discount for construction risk. For the full quarterly breakdown, see our Q1 2026 market report.
Note the townhouse anomaly before reading any table in this article: townhouses average less per sq ft than apartments (AED 1,371 versus AED 1,969) not because they are "cheaper" but because they carry far more built-up area per dirham. A 2,200 sq ft townhouse at AED 1,371 still costs more in total than a 750 sq ft apartment at AED 1,969. Per-sq-ft and total price answer different questions — a theme we return to at the end.
How Price Per Sq Ft Is Actually Measured (the BUA Gotcha)
Before the tables, the measurement rule that quietly distorts most comparisons: Dubai quotes price per square foot on built-up area (BUA), not on the space you can actually walk on. BUA is measured from the outer edges of the external walls and includes internal walls, columns and — in apartments — typically a proportional share of common areas, per Oliva's Dubai BUA glossary. DLD registrations and title deeds use BUA as the standard measurement, and it is the figure in your sales and purchase agreement.
The practical consequence: net usable area — what you can furnish — is typically only 70–85% of BUA. A 1,200 sq ft (BUA) apartment may offer roughly 900–1,000 sq ft of usable space. Two towers can both list at AED 1,800 per sq ft while one delivers 83% efficiency and the other 72%; on a usable-space basis, the "identical" prices are more than 10% apart.
| Measure | What it counts | Who uses it |
|---|---|---|
| BUA (built-up area) | Everything inside the external walls, incl. internal walls; often a share of common areas | DLD title deeds, SPAs, listing prices — the per-sq-ft basis |
| GFA (gross floor area) | Total building floor area across all levels | Planning and regulatory authorities |
| Net / usable area | Interior space you can actually use — typically 70–85% of BUA | Nobody officially — which is exactly the problem |
Every figure in the tables below is on the BUA basis, because that is what the underlying DLD transaction data records. Just remember when comparing buildings that the efficiency ratio is a hidden second variable — always ask for the net area, not just the headline number.
The Full Table: Apartments by Area (2026)
The core dataset. Point figures are transaction averages for 1 January – 6 June 2026 from Property Monitor / DLD data; budget-tier ranges are early-2026 DLD-cited ranges from Takween Aldar's per-sq-ft guide, used where transaction volumes are thinner. Areas are ordered cheapest to most expensive.
| Area | AED / sq ft | USD / sq ft | Data basis |
|---|---|---|---|
| International City | 700–850 | 191–231 | Early 2026 range (DLD-cited) |
| Discovery Gardens | 850–1,000 | 231–272 | Early 2026 range (DLD-cited) |
| Dubai Silicon Oasis | 900–1,100 | 245–300 | Early 2026 range (DLD-cited) |
| Dubai Sports City | 1,332 | 363 | H1 2026 avg (Property Monitor) |
| Jumeirah Village Circle (JVC) | 1,510 | 411 | H1 2026 avg (Property Monitor) |
| Arjan | 1,568 | 427 | H1 2026 avg (Property Monitor) |
| Jumeirah Lake Towers (JLT) | 1,831 | 499 | H1 2026 avg (Property Monitor) |
| JBR (Jumeirah Beach Residence) | 1,650–2,500 | 449–681 | 2026 projected range (REIDIN-based) |
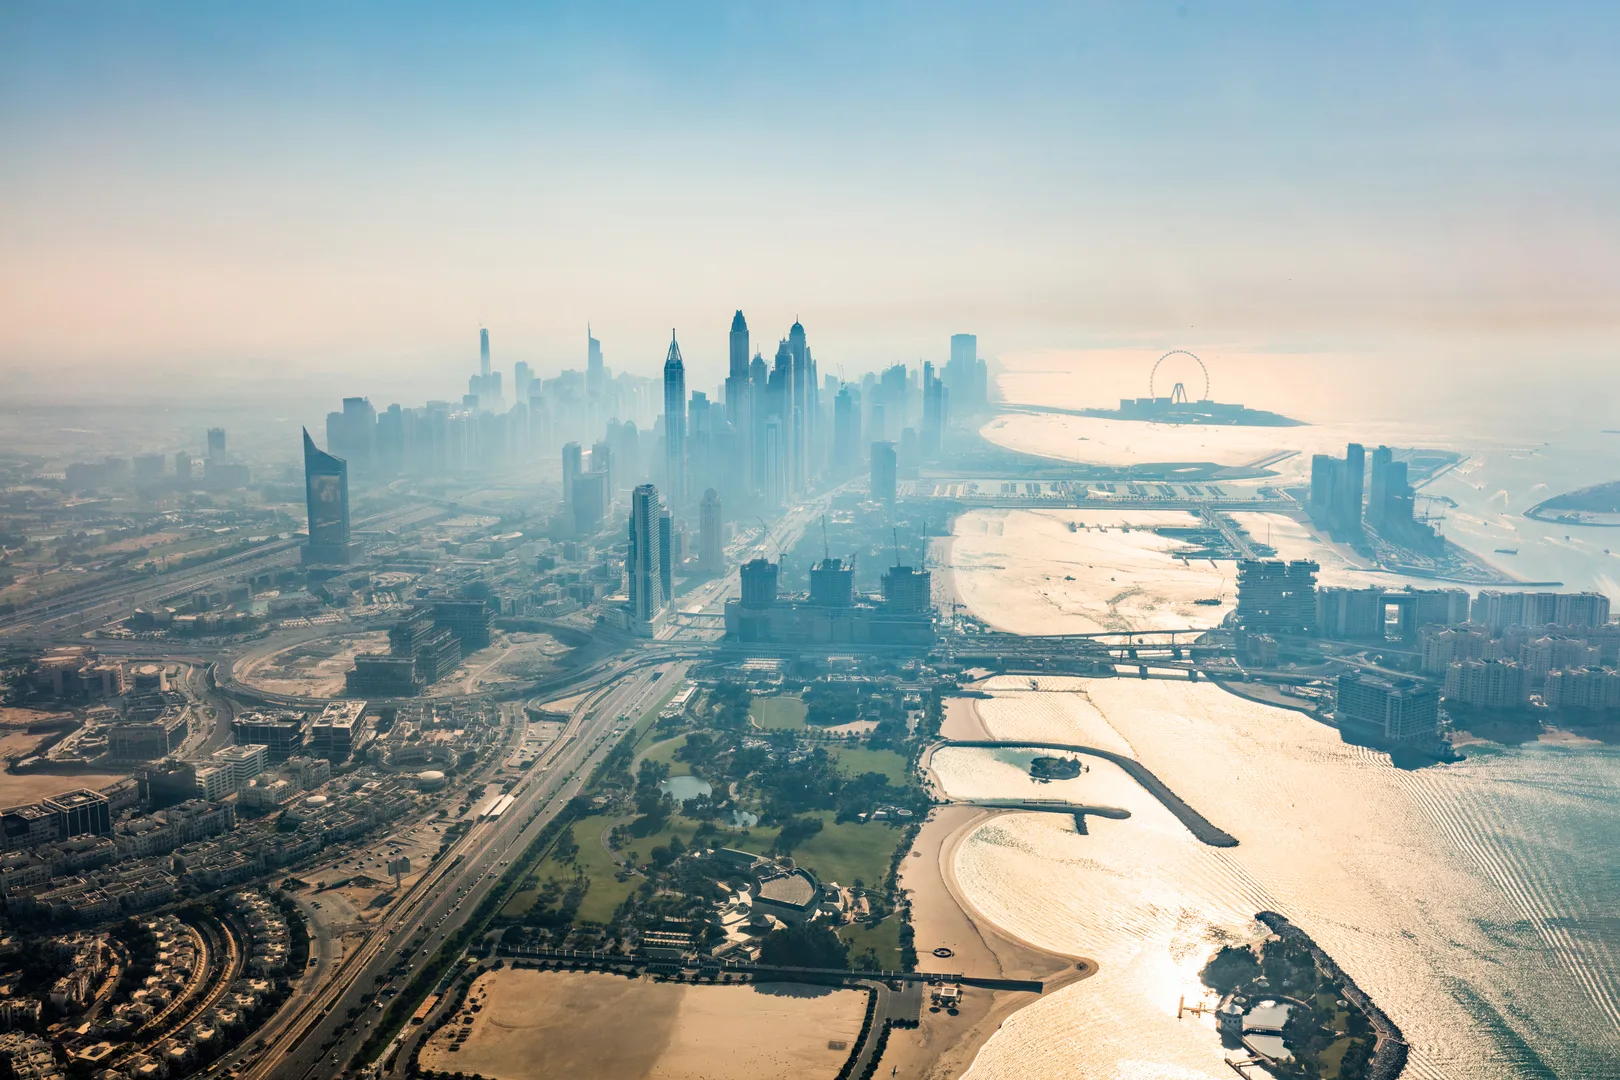
| Dubai Marina | 2,058 | 560 | H1 2026 avg (Property Monitor) |
| Dubai Hills Estate | 2,432 | 662 | H1 2026 avg (Property Monitor) |
| Business Bay | 2,547 | 693 | H1 2026 avg (Property Monitor) |
| Dubai Creek Harbour | 2,600 | 708 | H1 2026 avg (Property Monitor) |
| Downtown Dubai | 3,011 | 820 | H1 2026 avg (Property Monitor) |
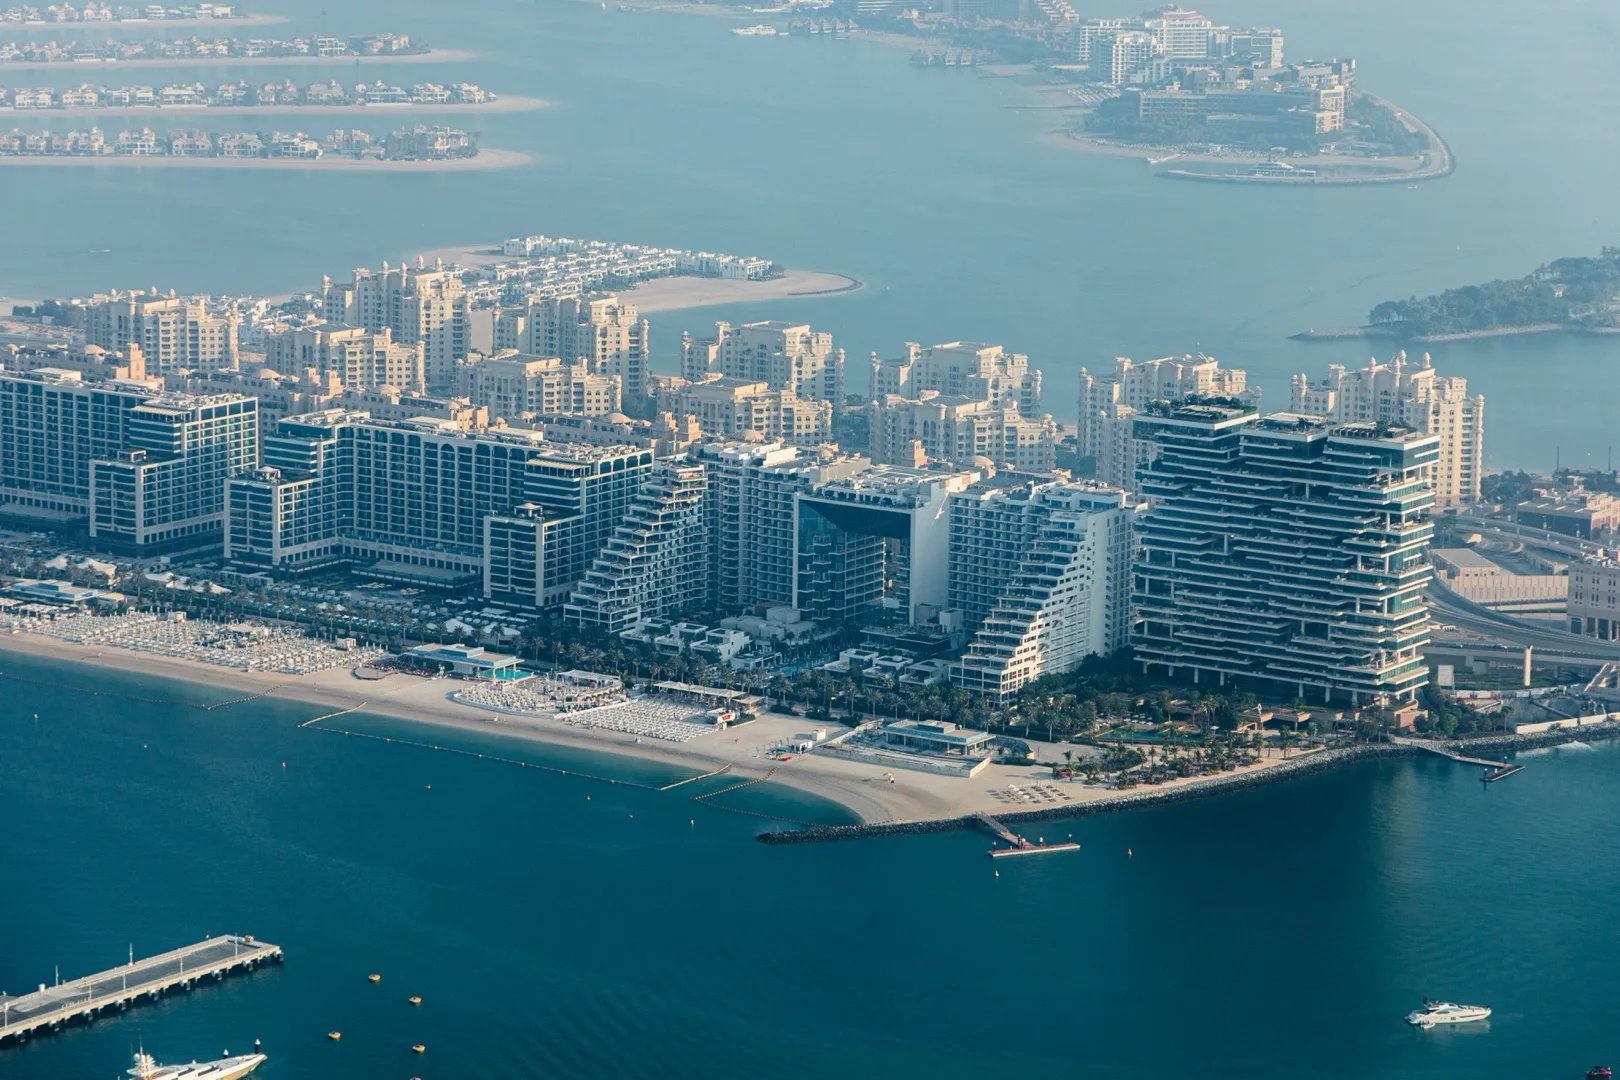
| Palm Jumeirah (apartments) | 4,240 | 1,155 | H1 2026 avg (Property Monitor) |
Sources: Property Monitor / DLD via Engel & Völkers (Jan–Jun 2026); Takween Aldar DLD-cited ranges (early 2026); REIDIN-index-projected range for JBR. All figures on BUA basis; USD at the 3.6725 peg.
Three patterns worth pulling out of the apartment table. First, the budget tier still exists: International City, Discovery Gardens and Dubai Silicon Oasis all transact below AED 1,100 per sq ft, well under half the city average — our International City area guide covers what those entry prices actually buy. Second, the mid-market cluster (JVC, Arjan, Sports City) sits in a tight AED 1,300–1,600 band — these areas compete with each other on yield rather than prestige, which is why they dominate our highest-ROI areas ranking. Third, the jump from prime to ultra-prime is a step change, not a gradient: Downtown to Palm Jumeirah is a 40% leap, and the Palm's apartment average alone exceeds many cities' villa pricing.
The Full Table: Villas and Townhouses by Area (2026)
Villa data is lumpier than apartment data — fewer transactions, bigger tickets, more product variation — so this table mixes two transaction-based sources and labels each: H1 2026 averages from Property Monitor / DLD, and full-year 2025 averages from Bayut's annual sales market report where 2026 area averages are not yet published. Treat the FY 2025 rows as slightly conservative given 2026's continued growth.
| Area | AED / sq ft | USD / sq ft | Data basis |
|---|---|---|---|
| DAMAC Hills 2 | 1,015 | 276 | FY 2025 avg (Bayut) |
| Dubai South | 1,331 | 362 | FY 2025 avg (Bayut) |
| JVC (villas/townhouses) | 1,359 | 370 | FY 2025 avg (Bayut) |
| Al Furjan | 1,531 | 417 | FY 2025 avg (Bayut) |
| Dubailand | 1,582 | 431 | FY 2025 avg (Bayut) |
| Arabian Ranches 3 | 1,738 | 473 | FY 2025 avg (Bayut) |
| DAMAC Hills | 1,908 | 520 | H1 2026 avg (Property Monitor) |
| Tilal Al Ghaf | 2,034 | 554 | H1 2026 avg (Property Monitor) |
| The Springs | 2,306 | 628 | H1 2026 avg (Property Monitor) |
| Arabian Ranches 1 | 2,417 | 658 | H1 2026 avg (Property Monitor) |
| Jumeirah Golf Estates | 2,524 | 687 | H1 2026 avg (Property Monitor) |
| Dubai Hills Estate | 2,896 | 789 | H1 2026 avg (Property Monitor) |
| Palm Jumeirah (villas) | 8,070 | 2,197 | H1 2026 avg (Property Monitor) |
| Emirates Hills | ~12,000–17,000 | ~3,267–4,629 | 2026 quoted range (REIDIN-based) |
Sources: Property Monitor / DLD via Engel & Völkers (Jan–Jun 2026); Bayut Dubai Sales Market Report 2025 (full-year averages); Emirates Hills range per REIDIN-index-based 2026 estimates, with point quotes around AED 14,500/sq ft. BUA basis; USD at the 3.6725 peg.
The villa table tells the clearest two-market story in Dubai. Below roughly AED 1,800 per sq ft sits the volume villa market — DAMAC Hills 2, Dubai South, Al Furjan, Dubailand — where families and yield investors buy townhouses on the city's expanding edge. Above AED 2,300 sits the established-community market — Arabian Ranches, Jumeirah Golf Estates, Dubai Hills — where mature landscaping, schools and golf frontage are priced in; our Dubai Hills Estate guide unpacks the premium. And then there is the beachfront-and-trophy tier, where Palm Jumeirah at AED 8,070 and Emirates Hills in five figures stop behaving like housing and start behaving like art — pricing driven by scarcity of plots, not replacement cost. The Palm Jumeirah area guide covers that market's mechanics in detail.
2025 → 2026: Which Segments Moved Fastest
A static table hides the most investable information: direction of travel. Bayut's full-year 2025 report tracked per-sq-ft change by area and segment, and the pattern is unambiguous — the budget and outer-mid tiers grew fastest while established prime grew slowest, as affordability pressure pushed demand outward.
| Area (segment) | FY 2025 AED / sq ft | Change vs 2024 |
|---|---|---|
| Dubai Silicon Oasis (apartments) | 1,108 | +28.5% |
| Arabian Ranches 3 (villas) | 1,738 | +27.8% |
| Dubailand (villas) | 1,582 | +23.5% |
| Al Furjan (villas) | 1,531 | +22.5% |
| Dubai South (villas) | 1,331 | +21.6% |
| JVC (villas) | 1,359 | +17.4% |
| Arabian Ranches (villas) | 2,197 | +15.7% |
| Arjan (apartments) | 1,452 | +13.2% |
| DAMAC Hills 2 (villas) | 1,015 | +12.9% |
| Dubai Hills Estate (villas) | 2,731 | +12.7% |
| DAMAC Hills (villas) | 1,722 | +11.1% |
| JVC (apartments) | 1,455 | +10.6% |
| Dubai Sports City (apartments) | 974 | +9.5% |
| Dubai Creek Harbour (apartments) | 2,559 | +6.5% |
| Downtown Dubai (apartments) | 3,134 | +5.5% |
| Dubai Marina (apartments) | 2,085 | +4.2% |
| JLT (apartments) | 1,589 | +4.0% |
| Business Bay (apartments) | 2,090 | +0.4% |
Source: Bayut Dubai Sales Market Report 2025 (full-year transaction-search data, change vs 2024). Note Bayut's FY 2025 averages run slightly below Property Monitor's H1 2026 figures for the same areas — both the data period and methodology differ.
Read the two ends of that table together and the 2025 story writes itself: Business Bay apartments were essentially flat (+0.4%) while Dubai Silicon Oasis ran +28.5%. Prime areas had already re-rated in 2021–2024; 2025's growth was the affordability catch-up trade. Whether that continues through 2026 — or whether the budget tier has now closed the gap — is the central question for anyone timing an entry, and the early-2026 transaction data (JVC at 1,510 versus 1,455 a year earlier; Sports City at 1,332 versus 974) suggests the catch-up still had fuel in the first half.
Following the Market?
Get Market Data in Your Inbox
DLD transaction data, price trends, and quarterly forecasts — before everyone else.
✓ You're in! Check your inbox.
What Each Price Tier Actually Buys You
Numbers without texture mislead. Here is what each per-sq-ft band means on the ground in 2026.
Under AED 1,100 / sq ft — the entry tier
International City, Discovery Gardens, Dubai Silicon Oasis and DAMAC Hills 2 villas. Older or far-from-centre stock, basic finishes, but genuinely functional communities with the highest gross yields in the city. This is where AED 500,000–800,000 still buys a real, rentable asset. The trade-off is capital-growth dependence on city expansion reaching you, and tenant pools skewed to budget-driven renters.
AED 1,100–1,700 / sq ft — the volume mid-market
JVC, Arjan, Sports City, Al Furjan, Dubai South and Dubailand townhouses. Dubai's transaction engine room — the widest buyer pool, the deepest rental demand, and most of 2025's fastest price growth. Finishes vary enormously by developer, which is why two JVC towers a street apart can differ by AED 300 per sq ft. Per-sq-ft comparison matters most in exactly this tier.
AED 1,700–2,700 / sq ft — established prime
JLT, Marina, Business Bay, Dubai Hills apartments, Creek Harbour, Arabian Ranches and Jumeirah Golf Estates villas. You are paying for location maturity: metro access, waterfront or golf frontage, schools, and a deep resale market. Growth is slower but so is volatility — this is the tier where the price per square foot is least likely to surprise you in either direction.
AED 2,700–4,500 / sq ft — trophy-adjacent
Downtown, Palm Jumeirah apartments, Dubai Hills villas. Branded towers, Burj views, beach access. Yields compress toward 4–5% and the buyer pool shifts from investors to end-users and wealth-parkers. What you gain is liquidity at the top: these addresses sell in any market.
Above AED 4,500 / sq ft — the scarcity market
Palm Jumeirah villas (AED 8,070 average) and Emirates Hills (quoted around AED 14,500). Plot scarcity, not build cost, sets prices here — a Palm frontage cannot be manufactured. Per-sq-ft comparison starts to break down entirely at this level; buyers pay for the specific plot, view line and privacy, and two neighbouring villas can transact 50% apart.
If you want to translate a tier into a concrete shopping list, our companion piece on what AED 1 million actually buys area by area does exactly that for the most common budget, and the areas directory holds full guides for nearly every community in these tables.
Above or Below the City Average: The 2026 Dividing Line
With the city-wide residential average at roughly AED 1,916 per sq ft, the dividing line is informative. Areas transacting below it — International City, Discovery Gardens, DSO, Sports City, JVC, Arjan, JLT, and the entire volume villa belt from DAMAC Hills 2 to Arabian Ranches 3 — house most of Dubai's actual residents and generate most of its transactions. Areas above it — Marina (marginally), Dubai Hills, Business Bay, Creek Harbour, Downtown, the Palm and the trophy villa communities — generate most of its headlines and a disproportionate share of its value.
For investors, the below-average half is where per-sq-ft logic works hardest: stock is comparable, tenants are price-driven and a dirham saved per square foot flows directly into yield. In the above-average half, per-sq-ft becomes one input among many — view premium, brand, floor height and building age can each move a unit 15–20% against the area average. The single most expensive mistake in Dubai per-sq-ft analysis is applying budget-tier logic ("this tower is AED 200/sq ft cheaper, therefore better value") to prime stock, where the discount usually has a reason.
One newer market worth watching against this dividing line is Dubai Islands, where DAMAC and other developers launched aggressively into 2026 — we have broken down project-level pricing in our DAMAC Dubai Islands price-per-sq-ft guide, which is the natural companion read for anyone benchmarking beachfront off-plan against the established areas in this table.
Per-Sq-Ft vs Total-Price Thinking: How Investors Should Use This Table
Price per square foot is a comparison tool, not a valuation. It answers "am I paying a fair rate for this area and building?" — it does not answer "is this a good investment?" Those are different questions, and conflating them produces predictable errors in both directions.
Per-sq-ft thinking earns its keep in three situations: comparing similar units within one area (two JVC one-beds), spotting a mispriced listing against the area average, and benchmarking an off-plan launch against the surrounding secondary market — especially now that off-plan trades at a premium (around AED 2,100 per sq ft for apartments in Q1 2026, against AED 1,713-region ready stock in the same brokerage datasets). If a launch prices 30% above the neighbouring ready average, the payment plan is what you are really buying.
Total-price thinking takes over everywhere else. Rents are set per unit, not per square foot — a compact 680 sq ft one-bed and a sprawling 950 sq ft one-bed in the same building rent within a few thousand dirhams of each other, which means the smaller unit at a higher per-sq-ft rate often delivers the better yield. Liquidity is also total-price-driven: the deepest resale demand in Dubai sits at specific ticket sizes (around AED 1M, around AED 2M for golden-visa eligibility), regardless of how many square feet that buys.
An investor has AED 1.5M for an apartment. Option A: a 990 sq ft one-bed in JVC at ~AED 1,510/sq ft. Option B: a 590 sq ft studio-plus in Business Bay at ~AED 2,547/sq ft. On per-sq-ft, JVC looks 40% "cheaper" — but the Business Bay unit rents to a deeper corporate tenant pool at a similar absolute rent per dirham invested, and resells into a more liquid market. Neither is wrong; the point is that the per-sq-ft gap measures the area premium, not the investment quality. Run both through our ROI calculator with realistic rents and service charges before deciding.
Two towers in the same district both quote AED 1,800/sq ft. Tower 1 sells a "1,200 sq ft" one-bed with margin-heavy BUA — net usable space ~880 sq ft (73% efficiency). Tower 2 sells a "1,050 sq ft" unit with ~890 sq ft net (85% efficiency). Tower 1 costs AED 2.16M, Tower 2 costs AED 1.89M — AED 270,000 more for effectively the same usable home, plus permanently higher service charges, since those are also billed on BUA. Always divide the price by the net area before comparing, and remember transfer costs scale with the headline price too — model them with the DLD fee calculator.
Where This Data Comes From — and How to Track It Yourself
Every number in this article traces to DLD transaction records, surfaced through different analytics layers: Property Monitor's index and transaction averages (via Engel & Völkers' 2026 compilation), Bayut's price-per-square-foot tracking and annual reports, REIDIN-index-based projections for thinner segments, and quarterly brokerage analyses reported in the business press. Each layer uses slightly different methodology — Bayut's figures are influenced by listing-search behaviour, Property Monitor's by registered transactions — which is why the same area can show a 5–10% spread between sources. That spread is normal; treat any single point figure as the centre of a band, not gospel.
You can — and should — verify live numbers yourself before any purchase. DXBinteract publishes free transaction-level DLD data, Property Monitor sells the institutional layer, and REIDIN powers most bank valuations. We have compared all three in our Dubai data platforms guide, including which is best for checking the actual price per square foot of recent transactions in a specific building — the single most useful 15 minutes of due diligence available to a Dubai buyer at zero cost.
One honest caveat on currency of data: this market reprices quickly. The H1 2026 figures here cover transactions to early June 2026; by the time you negotiate, the area average may have moved a few percent in either direction. Use this table to set your frame and shortlist, then pull the last 90 days of transactions for your specific building or cluster before making an offer.
Frequently Asked Questions
What is the average price per square foot in Dubai in 2026?
Approximately AED 1,916 per sq ft (about USD 522) across all residential transactions from January to early June 2026, per Property Monitor data built on DLD records. By type: apartments average AED 1,969, townhouses AED 1,371 and villas AED 2,241 per sq ft. Q1 2026 brokerage data put the residential average at AED 1,949 per sq ft.
Which Dubai area has the cheapest price per square foot?
International City, at roughly AED 700–850 per sq ft in early 2026 — under half the city average. Discovery Gardens (AED 850–1,000) and Dubai Silicon Oasis (AED 900–1,100) follow. On the villa side, DAMAC Hills 2 is the entry point at around AED 1,015 per sq ft on full-year 2025 data.
Which area is the most expensive per square foot?
Emirates Hills, where villa pricing is quoted around AED 14,500 per sq ft on 2026 REIDIN-based estimates. Among areas with regular transaction volume, Palm Jumeirah leads: villas averaged AED 8,070 per sq ft and apartments AED 4,240 in H1 2026, followed by Downtown Dubai apartments at AED 3,011.
Is Dubai price per square foot quoted on built-up area or net area?
Built-up area (BUA) — measured from the outer face of external walls, including internal walls and usually a share of common areas. DLD title deeds and sales agreements use BUA. Net usable area is typically only 70–85% of BUA, so always ask for the net figure and divide the price by it when comparing two buildings.
Is off-plan cheaper than ready property per square foot?
No — the historical discount has inverted. In Q1 2026, off-plan apartments averaged around AED 2,100 per sq ft, trading above comparable ready stock. Buyers are effectively paying a premium for new product and developer payment plans, which makes benchmarking any launch against the surrounding secondary market essential before committing.
Are Dubai prices per square foot still rising in 2026?
Yes, on the transaction evidence available. Q1 2026 sales value rose 23.4% year-on-year, and area-level averages in early 2026 sit above their full-year 2025 levels — JVC apartments at AED 1,510 versus 1,455, Dubai Sports City at AED 1,332 versus 974. Growth is fastest in budget and outer mid-market areas; established prime areas such as Business Bay and Dubai Marina were nearly flat through 2025.
Why do different websites show different prices per square foot for the same area?
Methodology. Bayut's figures reflect listing and search data, Property Monitor and DXBinteract work from registered DLD transactions, and REIDIN runs a valuation index — each with different time windows and property mixes. A 5–10% spread between sources for the same area is normal. For a purchase decision, pull recent actual transactions for the specific building rather than relying on any single area average.
Should I buy based on price per square foot or total price?
Use both, for different jobs. Per-sq-ft tells you whether a specific unit is fairly priced against its area and building. Total price drives your rental yield (rents are set per unit, not per foot) and your resale liquidity (demand clusters at ticket sizes like AED 1M and AED 2M). The best-value purchase is typically a fairly-priced-per-foot unit at a high-liquidity total price point.
This table sets the frame — the deal-level work is checking your exact tower or cluster against the last 90 days of transactions. The REC community includes investors who track per-sq-ft data across every area in this article and will tell you, with receipts, whether an asking price is fair. Start with our Q1 2026 market report for the macro picture, then model your numbers with the ROI calculator before you commit.
Want a Data-Backed Second Opinion?
Tell us your plans — we'll share what the data says about your timing.
Thank You!
We'll get back to you within 24 hours.
Real Estate Agencies in Dubai
Explore providers from our business directory
Still have questions?
Ask a follow-up, or get connected with a vetted Dubai professional.
Follow us on LinkedIn
Dubai market analysis and industry insight for professionals.